Changing Needs of Newspaper Readers, 1978

In 1979, Ruth Clark, noted newspaper researcher, authored a thoughtful report for the American Society of Newspaper Editors titled “Changing Needs of Changing Readers.” Commissioned during a time of declining readership, the report explored a question that still resonates: why were people turning away from newspapers It was based on focus groups across 12 U.S. and Canadian cities and uncovered a subtle but growing disconnect between editors and readers. The issue wasn’t just about what was in the paper—it was about how people felt about their newspapers. (Summary written by AI)

The Social Contract Was Fraying

Readers no longer saw editors as all-knowing gatekeepers. In fact, many questioned why faceless editors still dictated the “important” news. What they really wanted was relevance: stories that spoke to their personal lives, their neighborhoods, their struggles. “I live in one world—they live in another,” one reader lamented.

From Mandarins to Humans

The report described a “reader-editor gap” that went far beyond content. Readers wanted to see and feel the people behind the bylines, a shift toward what we might now call personalized journalism. The cold objectivity of traditional reporting began to feel alienating in a media world increasingly influenced by charismatic TV anchors and talk radio hosts.

Rise of the “Me” Generation

The study captured a cultural pivot from civic obligation to personal fulfillment. Readers didn’t just want to be informed—they wanted to be helped. They craved guidance on how to live well, manage money, understand relationships, and yes, have fun. Traditional hard news still mattered, but only when balanced with accessible, emotionally resonant content.

Format Fatigue

Even then, readers complained newspapers were too hard to navigate. They wanted summaries, indexes, modular content, and less repetitive reporting. One participant nailed it: “I can wait till the story is over and then find out what is really important.”

The Real Lesson: Listen More

The report didn’t offer a silver bullet—but it validated a method: direct, honest conversations with readers. Focus groups were a prototype for what we now know as audience engagement strategies. For a print industry historically rooted in one-way communication, this was radical.

Though this report is nearly half a century old, its themes resonate in today’s digital landscape. The need for human connection, relevance, transparency, and flexibility continues. As media evolved from analog to digital, the core need hasn’t changed: people want their stories told with care, by people who understand them. Readers want to see themselves in the media they are using.
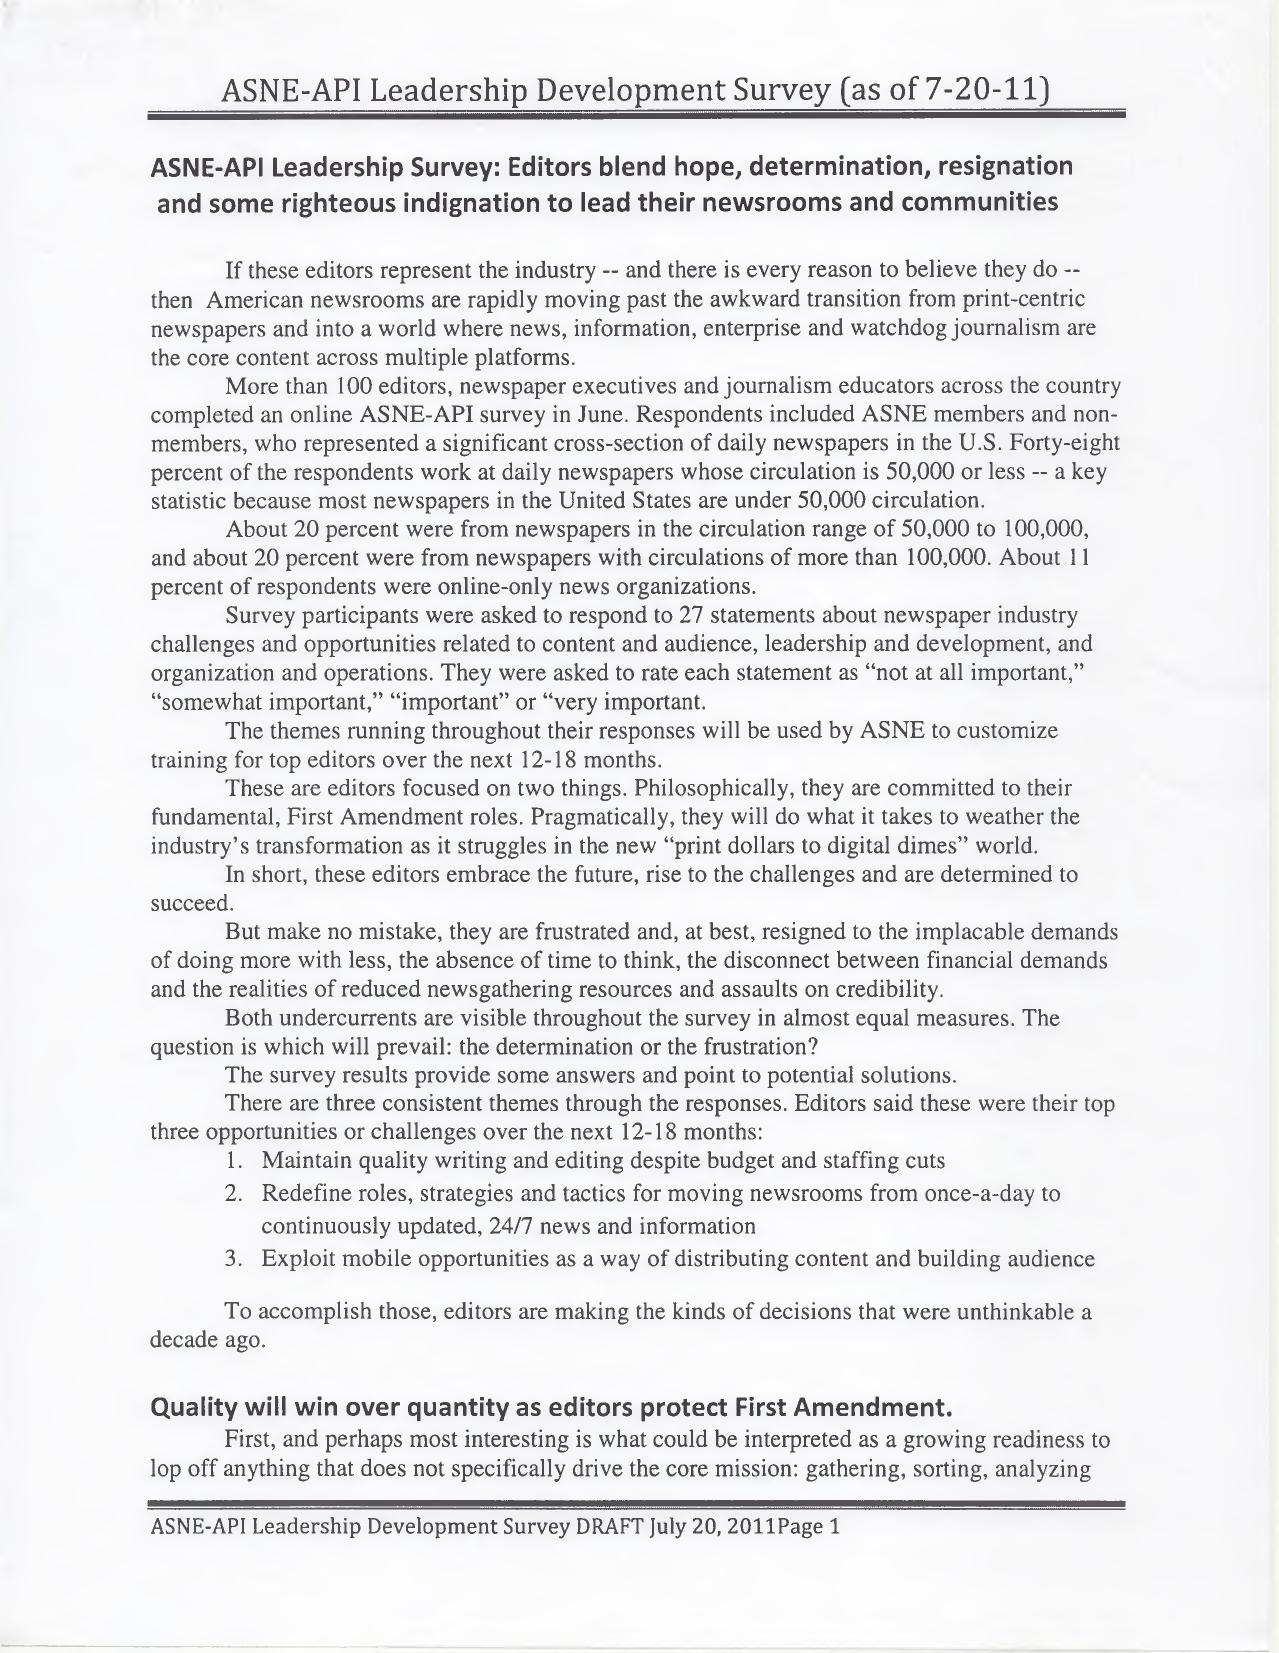
Draft report pages from the July 2011 ASNE and American Press Institute survey of newspaper editors

ASNE-API Leadership Survey, July 2011

This is the draft report of a joint survey by the American Society of News Editors and the American Press Institute, dated July 20, 2011. Invitations went to 1,830 editors at about 1,400 daily newspapers, 50 online-only news sites and the deans of 100 accredited journalism schools. One hundred five people responded — nearly half of them from papers with circulations of 50,000 or less, which is where most American dailies live. Respondents rated 27 statements about content and audience, leadership and development, and organization and operations. ASNE planned to use the findings to shape training for top editors over the following 12 to 18 months, beginning with a regional workshop in Lexington, Ky., in October.

The framing of the report is a tension the authors return to again and again — editors who are determined and editors who are worn down:

These are editors focused on two things. Philosophically, they are committed to their fundamental, First Amendment roles. Pragmatically, they will do what it takes to weather the industry’s transformation as it struggles in the new “print dollars to digital dimes” world.

The three top-ranked opportunities or challenges: maintain quality writing and editing despite budget and staffing cuts (83.8 percent called it “very important”); redefine roles, strategies and tactics for moving newsrooms from once-a-day publishing to continuously updated, 24/7 news; and exploit mobile opportunities to distribute content and build audience.

What gives the document its bite are the unattributed editor comments:

“It’s time,” wrote one editor, “for newsrooms to focus on finding ways to do fewer things well, instead of doing everything poorly.”

“Too many interruptions, distractions,” wrote one editor. “Not able to put together a stretch of time that’s long enough to focus and complete anything that can’t be accomplished in five minutes. … I can get a lot of things started, but it’s becoming harder and harder to see them through to successful completion.”

“We are all in this same leaky boat together and it’s time to let go of our old ideas about labor and management. We all need to start building a new ship — and fast.”

The draft press release attached to the report quotes Linda Grist Cunningham, vice chair of ASNE’s Leadership Committee; Carol Ann Riordan, interim executive director of the American Press Institute; and Mizell Stewart III, editor of the Evansville (Ind.) Courier & Press and chair of the Leadership Committee.

“The affirmation that editors can stay focused on good journalism as they wrestle with spreadsheets and new technology isn’t unexpected,” said Linda Grist Cunningham … “But it certainly is reassuring.”

The report ends with the question it can’t answer:

The question remains: Which will prevail? The determination to succeed, to beat back the naysayers? Or the resignation that comes with fear, inertia and a mourning of the loss of the past?

Reading this in 2026 — fifteen years later — the survey is a useful marker of where newsroom leadership thinking stood at the start of the mobile era. The priorities the editors named are no longer strategic questions; they were settled by events. What remains strikingly current is the complaint that there is no time to think, and the one editor who predicted the tablet future and wrote, “This is the generation of transition.”

Cover of the Media Research Center special report Media Bias 101, last updated October 2009

Media Bias 101: Twenty Years of Research

A special report from the Media Research Center, marked “Last Updated: October 2009,” collecting two decades of polling into a single argument. The booklet is organized in three chapters: what journalists think and how journalists vote; what the public thinks about the media; and what journalists themselves say about media bias — divided into those denying it and those admitting it.

Chapter one runs 16 exhibits, from the 1981 Lichter-Rothman study The Media Elite through the Weaver and Wilhoit surveys at Indiana University, the 1985 Los Angeles Times poll of 2,700 journalists at 621 newspapers, ASNE’s 1996 The Newspaper Journalists of the ’90s, Pew’s 2004 survey of 547 journalists and media executives, and Slate’s pre-election staff polls in 2000, 2004 and 2008. The MRC’s framing is explicit about the provenance of the data:

These surveys of journalists were conducted by professional pollsters, academics or news organizations, not by conservatives trying to score a political point against the press.

Chapter two turns the lens around, with 19 exhibits of public opinion research — Pew, Gallup, ASNE’s 1998 Journalism Credibility Project, Rasmussen, Harvard’s National Leadership Index, the Sacred Heart University Polling Institute, the Missouri School of Journalism. The chapter’s thesis:

These polls document a crisis for the news media. Years of skewed reporting has squandered the public’s trust.

The third chapter is a clip file of quotations, arranged as “Journalists Denying Liberal Bias” and “Journalists Admitting Liberal Bias,” running back to 1989. Among the admissions, New York Times Public Editor Daniel Okrent’s July 25, 2004 column asking “Is The New York Times a Liberal Newspaper?”:

Of course it is…. These are the social issues: gay rights, gun control, abortion and environmental regulation, among others. And if you think The Times plays it down the middle on any of them, you’ve been reading the paper with your eyes closed.

And, from the same chapter, Seattle Times Executive Editor David Boardman in an August 15, 2007 e-mail to his staff:

If we wore our politics on our sleeves in here, I have no doubt that in this and in most other mainstream newsrooms in America, the majority of those sleeves would be of the same color: blue.

The closing page describes the organization: founded in 1987, based in Alexandria, Virginia, with divisions including the Business & Media Institute, the Culture & Media Institute, TimesWatch.org, NewsBusters.org and CNSNews.com.

Reading this in 2026, the numbers are a period piece but the argument is not. Every trust-in-news survey since has kept measuring the same gap the MRC was documenting here, and the partisan split in who believes which outlet — which this report flagged in 2009 — has only widened. Worth having in the archive as a primary document: this is how the case was assembled, exhibit by exhibit, at the end of the first decade of the century.

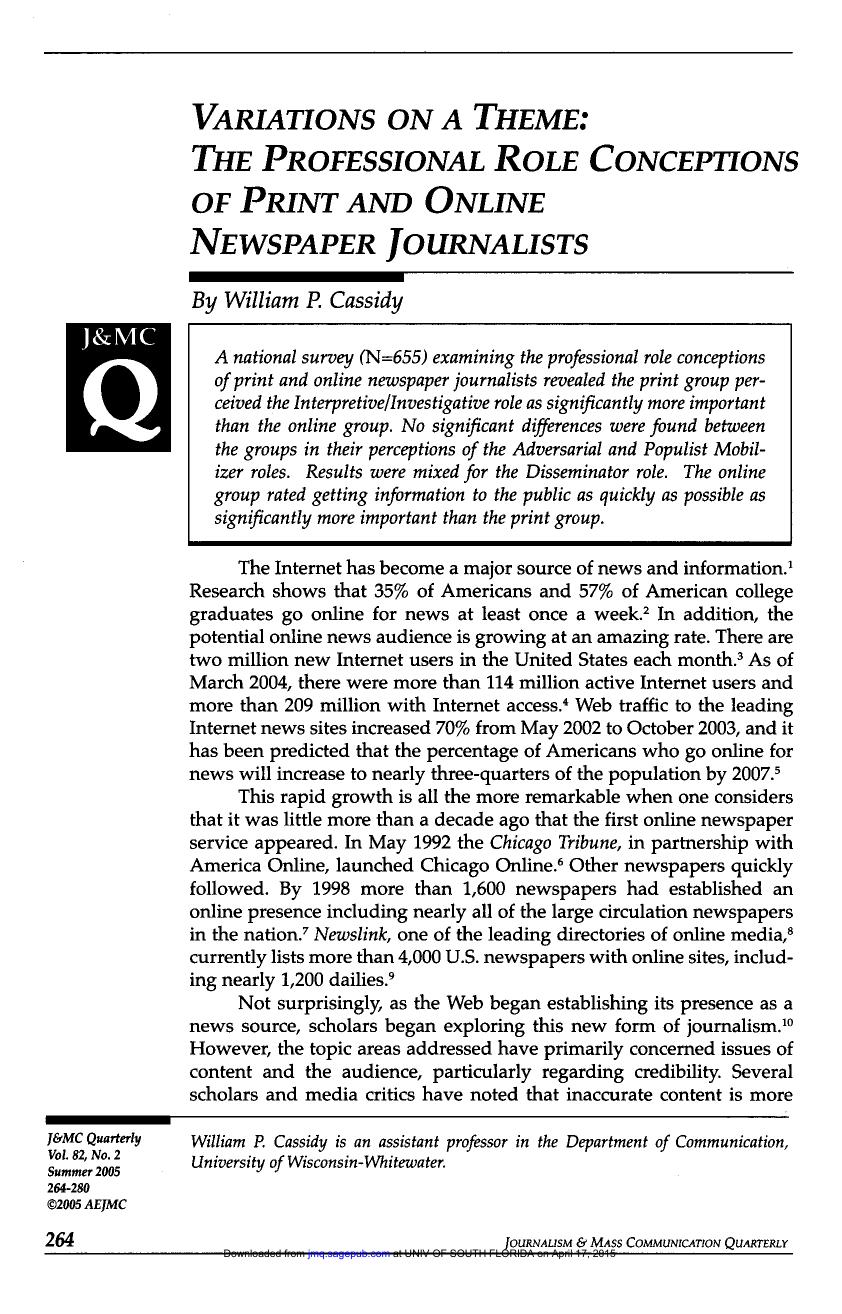
Opening page of William P. Cassidy's 2005 Journalism & Mass Communication Quarterly study on the role conceptions of print and online newspaper journalists

2005 Study of Print & Online Newsroom Roles

This is William P. Cassidy’s article “Variations on a Theme: The Professional Role Conceptions of Print and Online Newspaper Journalists,” published in Journalism & Mass Communication Quarterly, Vol. 82, No. 2, Summer 2005, pages 264-280. Cassidy was an assistant professor in the Department of Communication at the University of Wisconsin-Whitewater; the data came from his 2003 Ph.D. dissertation at the University of Oregon.

The question behind the study was one the industry was arguing about at the time without much evidence: were online journalists a different species from their print colleagues, or the same people working at a different speed? Cassidy went at it with a national Web-based survey, sending 3,330 invitations between July 15 and August 25, 2003, and getting 655 usable responses — 456 print newspaper journalists and 199 online newspaper journalists — from 271 newspapers in all 50 states and the District of Columbia. The response rate was 23.1%.

He measured the responses against the four role conceptions Weaver and Wilhoit had established: interpretive/investigative, disseminator, adversarial, and populist mobilizer. The headline finding, from the abstract:

A national survey (N=655) examining the professional role conceptions of print and online newspaper journalists revealed the print group perceived the Interpretive/Investigative role as significantly more important than the online group. No significant differences were found between the groups in their perceptions of the Adversarial and Populist Mobilizer roles. Results were mixed for the Disseminator role. The online group rated getting information to the public as quickly as possible as significantly more important than the print group.

In other words: print journalists scored higher on investigating government claims, analyzing complex problems, and discussing national policy (6.10 versus 5.74 on a seven-point scale). Online journalists scored higher on speed (6.46 versus 6.03). But on staying away from stories where the facts cannot be verified — the accusation most often aimed at online newsrooms in that era — there was no significant difference at all. Both groups took it seriously.

That last result matters, because the surrounding literature Cassidy reviews was full of the assumption that online publishing had corroded verification. He quotes Ann Brill’s characterization of the problem:

rush to production has allowed rumor to pass as reporting and electronic processing to pass for editing

Cassidy’s own reading of his data is gentler: “Perhaps online journalists are simply getting a bad rap from these journalists.” He suggests the online journalists in his sample, working for daily newspapers rather than Web-only operations, had absorbed the same newsroom norms as everyone else in the building.

I have a personal stake in this one. The credibility research Martha L. Stone, Diane Lynch and I did for the Online News Association — the “Digital Journalism Credibility Study,” published January 31, 2002 — is cited twice in the notes, in support of the point that the public rated online news about as credible as news from other sources. It is a small thing to find your own work in someone else’s footnotes, but it is a reminder that the arguments we were having inside newsrooms were also being tested, carefully, by people outside them.

The article also offers a useful bit of chronology for anyone dating the online news era, noting that in May 1992 the Chicago Tribune, in partnership with America Online, launched Chicago Online, and that by 1998 more than 1,600 newspapers had an online presence.

Reading this in 2026, the striking thing is that the study’s central dividing line no longer exists. There is no “print group” and “online group” to compare; there is a newsroom, and everything it publishes goes out digitally first. What has survived is the tension Cassidy measured — the pull between interpretation and speed. Twenty years on, with AI-generated summaries and an endless publishing clock, that tension hasn’t been resolved so much as industrialized.

Cover page of the 2004 American Society of Newspaper Editors report Journalism Education: An Editors' Agenda

Journalism Education: An Editors’ Agenda, 2004

This is the American Society of Newspaper Editors report Journalism Education: An Editors’ Agenda, published in 2004 by the ASNE Education for Journalism Committee. Jerry Ceppos of Knight Ridder chaired the committee and wrote the report; I served on the committee representing The Poynter Institute, along with Jennie Buckner, Judy Pace Christie, Richard S. Holden, Saundra E. Keyes, Maryanne B. McNellis, Annette Jo Procter, Susanne Shaw, George Thottam and Kenneth M. Winter.

The report summarizes a February 2004 survey of ASNE members, conducted mostly by e-mail, with a 33 percent response rate — about 180 members, though the number varied by question. The survey was inspired by a suggestion from Susanne Shaw of the University of Kansas and by earlier research from Lee Stinnett, the former ASNE executive director.

The finding, as Ceppos put it, was not subtle:

Journalism schools can’t provide too much practical, skills-based learning, according to ASNE members.

Editors were tough graders. Two-thirds mostly disagreed that today’s graduates had a better grasp of the English language than graduates five years earlier. Less than two percent strongly agreed that graduates had a broad-enough range of knowledge across subjects. Only one percent strongly agreed that graduates think more analytically. The bright spots: more than eight in 10 agreed graduates better understood the importance of diversity, and six in 10 agreed they better understood journalism ethics.

The open-ended answers carried the report. A sampling:

“MAKE EVERYONE WRITE MORE!! I think a journalism major should have to write in every class, every week! I am disheartened when I see how little some journalism students actually write. I would not like to be operated on by a surgeon who’d had as little practice in cutting as some journalism graduates have had in writing.” — Bob Haiman, The Freedom Forum

“More required hands-on production of news: publishing articles, photos, page layout, headlines, writing editorials and producing news Web pages.” — Gilbert Bailon, Dallas Morning News

Educators pushed back, or at least complicated the picture. Tom Kunkel, then dean at the University of Maryland, described the squeeze:

“But keeping that focus is more challenging by the year, as we’re expected to stay current with the industry’s technological advances and offer more courses on, say, ethics, and yet still not exceed the number of credit hours students can take in the major. Too often and at too many places, I fear, it’s the core skills that get shorted.”

Ceppos closed by naming the contradiction in his own data — editors said schools were best at teaching the basics, and also that the basics weren’t good enough:

My interpretation of the apparent conflict: Editors want more teaching of the basics and believe that it’s what journalism schools do best–but they still expect students to do even better.

A personal note on why this document matters to me. I was sitting on this committee at exactly the moment Poynter was building News University, the online training effort I would go on to lead. The editors answering this survey were, in effect, describing the demand: more writing, more reporting, more hands-on practice, more of it available to people already in newsrooms and to students who weren’t getting enough of it in class. NewsU was one answer to that demand — self-paced, low-cost, scalable in a way a week-long seminar in St. Petersburg could never be.

Reading it now, in 2026, the complaint is remarkably durable. Every generation of editors has told every generation of educators to teach more writing and more reporting, and that argument outlived most of the newsrooms that were hiring in 2004. What has changed is the technology gap: in this survey, “producing news Web pages” was the forward-looking ask. Today the same conversation is about generative AI in the classroom and in the newsroom. But the underlying question the committee was chasing — what should a journalism graduate actually be able to do on day one — hasn’t changed at all.

Cover of the Pew Internet & American Life Project report America's Online Pursuits, dated December 22, 2003

America’s Online Pursuits: Pew’s 2003 Snapshot

A December 22, 2003 report from the Pew Internet & American Life Project, pulling together more than three years of tracking survey data into one picture of who was online and what they were doing there. The numbers come from telephone interviews conducted by Princeton Survey Research Associates between March 2000 and December 2002, with additional data from an August 2003 survey.

The headline finding is a plateau. After the rush of the late 1990s, the online population had essentially stopped growing, even as the people already there kept finding more to do.

63% of Americans now go online — last measured in our August 2003 survey.

31% of Internet users who go online from home have broadband as of August 2003.

Email was still the center of gravity, and the report says so plainly. Among the 25 core activities tracked, online banking grew fastest — the kinds of transactions that required people to trust the medium.

Email continues to be the “killer app” of the Internet. More people use email than do any other activity online.

Online banking increased by 127% — more than any other activity about which we asked 2000 and 2002. In March 2000, just 15 million had tried some form of online banking, but by October 2002, 34 million had done so.

For those of us in the news business, the news line is the one worth marking: the online news audience grew 50% between March 2000 and December 2002, from 52 million to 78 million, and Pew credits big events — Campaign 2000, September 11, the run-up to the Iraq war — with each ratcheting the daily audience up a notch and leaving it there.

The conclusion reads as a prediction, and it holds up better than most:

All the trends set out here seem destined to continue, if not evolve, as the technology gets better, the applications become simpler, the appliances that use the Internet become omnipresent, and the technology fades into the background of people’s lives — as powerful, ubiquitous, commonplace, and “invisible” as electricity.

Some 2026 context for the numbers above, which is what makes this document interesting to me: the 63% of American adults online in August 2003 is now in the mid-90s — Pew’s recent tracking puts adult internet use at roughly 95%, which is about as close to universal as survey research gets. 

Home broadband, at 31% of home users in 2003, is now the norm rather than the advantage, and the “dial-up user” category that Pew compares against on nearly every page of this report has effectively vanished. Smartphone ownership, which does not appear in this report at all, now runs around 90% of adults, and a meaningful share of Americans go online only through a phone.

That last point is the real gap between 2003 and now. Pew’s 2003 framework assumed a computer, a connection, and a user who sat down to do a discrete thing — check a score, book a flight, read the news. The report’s own prediction about the technology fading into the background came true, and in doing so it dissolved the categories Pew was counting.

Mary Madden is the principal author; Lee Rainie, the project’s director, is listed as editor.

Gartner research note listing twelve high-impact technologies with a Technology Radar Screen adoption timeline

Gartner’s Twelve Technologies For 2000 To 2010

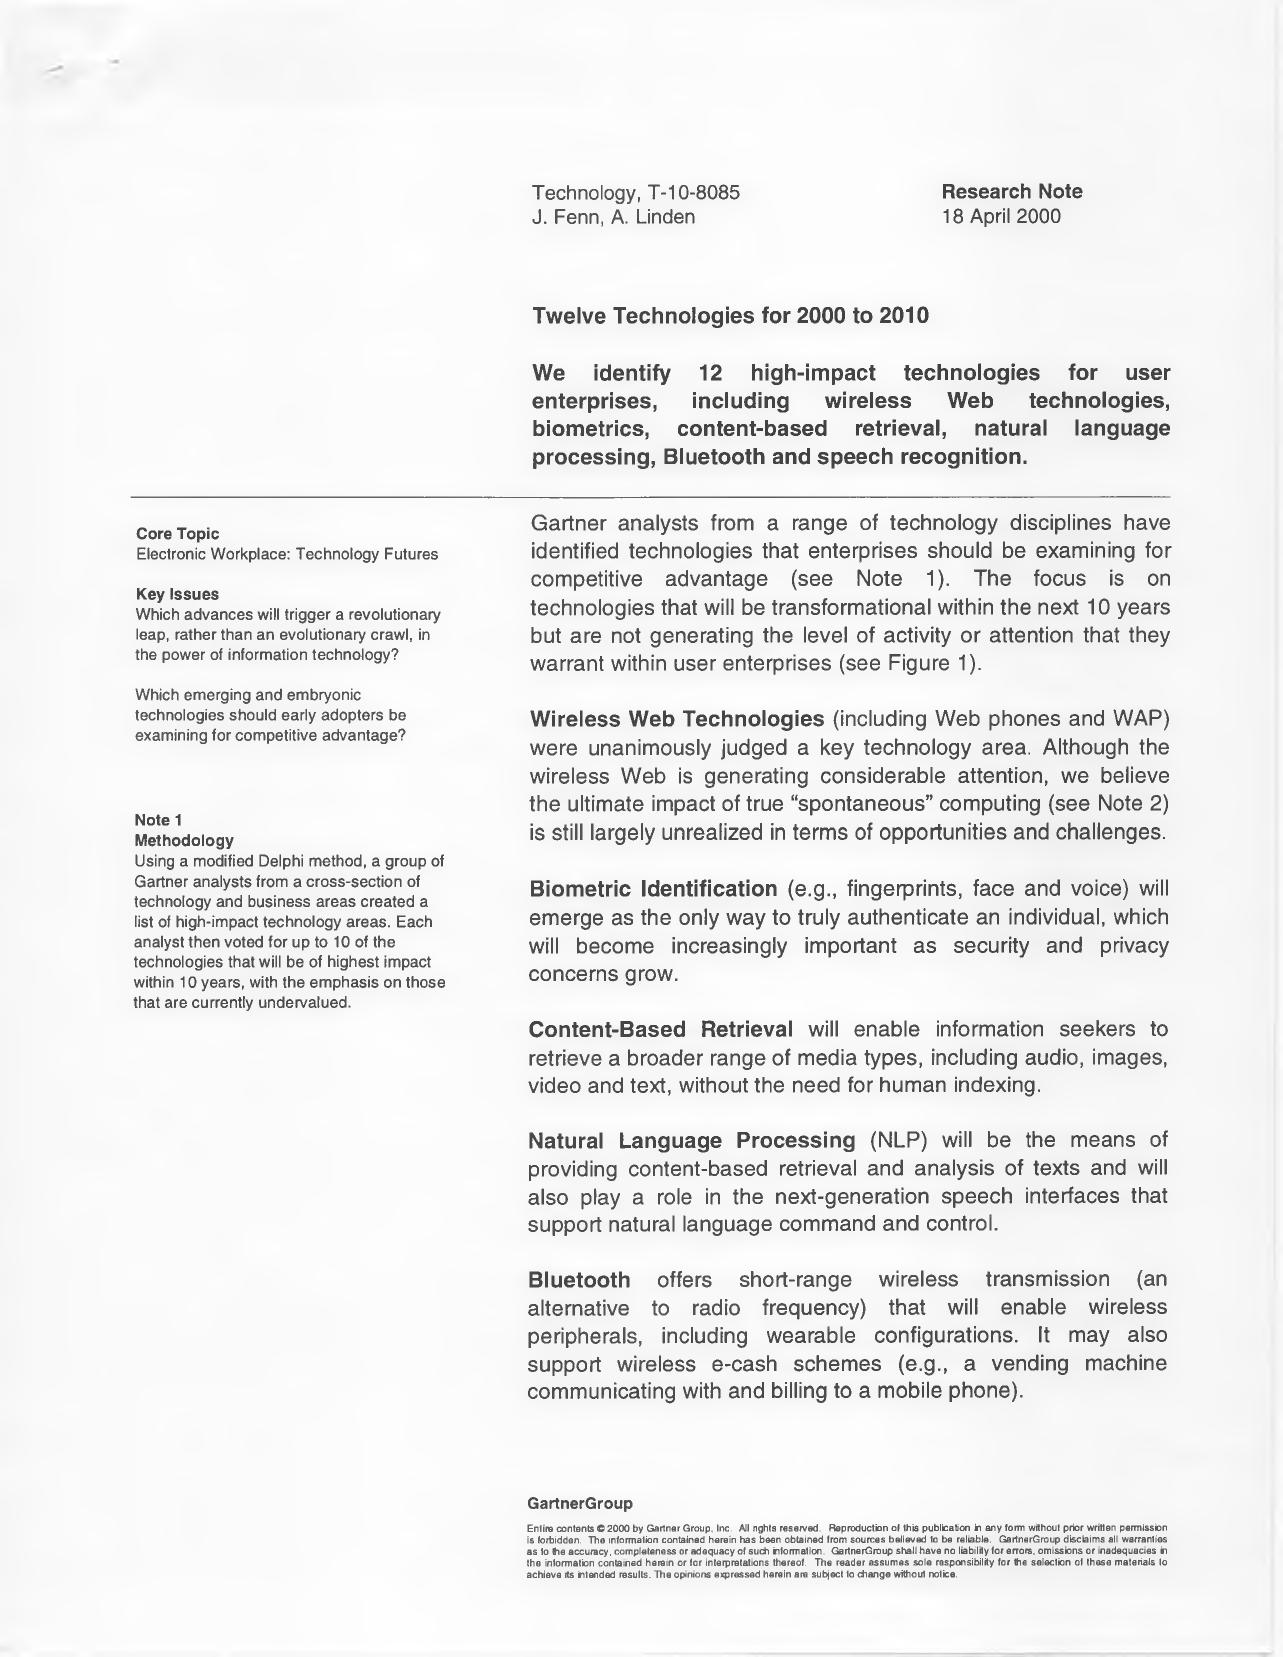
A Gartner research note (Technology, T-10-8085) by analysts J. Fenn and A. Linden, forecasting the technologies that would reshape enterprise computing over the coming decade. The note is short — two pages — but it is a useful snapshot of what the industry’s most-quoted research firm thought mattered as the century turned.

We identify 12 high-impact technologies for user enterprises, including wireless Web technologies, biometrics, content-based retrieval, natural language processing, Bluetooth and speech recognition.

The twelve, as listed: Wireless Web technologies (including Web phones and WAP), biometric identification, content-based retrieval, natural language processing, Bluetooth, speech recognition, Webtops, XML for content and data exchange, embedded miniature computers, pattern recognition, e-cash and display technologies.

The methodology was a modified Delphi process — a cross-section of Gartner analysts built a list of high-impact technology areas, then each voted for up to 10, with the emphasis on those judged currently undervalued. Wireless Web technologies were the only unanimous pick.

A “Technology Radar Screen” figure assigns each technology a year marking “the point at which the technology begins the steepest part of its adoption curve”: XML in 2001, wireless Web, Webtops, Bluetooth and NLP in 2002, pattern recognition and content-based retrieval in 2004, speech recognition and biometrics in 2005, e-cash in 2006, display technologies in 2007, and embedded miniature computers in 2008.

The most interesting passage is a sidebar defining what the analysts called spontaneous computing:

An era of spontaneous computing will begin around 2007, predicated on the availability of ubiquitous, reliable wireless connectivity that will provide any time, any place access to information and messaging through highly portable or wearable systems with speech interfaces.

And the consequence they drew from it:

Instead of being the center of attention, information processing will become a secondary activity achieved while the user is performing some other task (driving or sitting in a meeting), leading to true multitasking.

The note closes with the standard Gartner formulation:

Bottom Line: Technology and business planners should evaluate these technologies as part of their technology portfolios to determine the impact on future IT and business directions.

Transcript pages from a 1999 American Press Institute seminar presenting newspaper design survey results

Is There a Disconnect Here Someplace?

This is a transcript section from an American Press Institute seminar held in October 1999, where I presented the results of a design and visuals survey I coordinated. It was a follow-up to the survey we did for the 1988 J. Montgomery Curtis seminar, Newspaper Design: 2000 and beyond, with a nod to the survey the Society of Newspaper Design did in 1992. We reused a lot of the same questions so we could see what had changed.

This just goes to show you that if you volunteer to do something, you get to do it again.

The numbers: 628 responses in 1988; a little over 1,200 in 1999, about 200 of those from a Web site we built for the project. Sixty percent came from designers, 40 percent from editors. Ninety percent worked at dailies, and about 45 percent at papers over 100,000 circulation. One notable difference from 1988 — we didn’t ask about color or the use of computers. By 1999 those were givens.

We organized the discussion around five areas: the importance of design, the importance of visual elements, people, the relationship between online and print (new that year), and where all of this material was going to fit in the future.

As for the importance of design, the survey showed that it remains strong in the opinion of both editors and designers. And as for visuals, we’re also optimistic. And that’s the good news. The bad news is there appears to be a big disconnect between editors and designers in how they view the world.

Some of that disconnect showed up in the self-scoring. Asked to rate the quality of newspaper design across the industry on a 1-to-10 scale, 13 percent gave the industry an 8 to 10 and 71 percent put it in the 5-to-7 range. Asked about their own newspapers, more than half rated themselves 8 to 10. As I said at the time: the industry sucks, but we’re doing okay at our own newspaper.

Warren Watson of API‘s staff took the results to some 50 publishers, editors, designers and educators for reaction, and it wasn’t flattering. Terry Quinn of Thomson Newspapers called the 1980s an infatuation period with design. Darrell Moen said design had simply become institutionalized — not special anymore. Around the table, Mr. Sutton put a sharper point on it:

I do think most editors see design simply as layout, and I believe there is a design backlash, because some visual journalists have too much of a “make it pretty” mentality.

The section on informational graphics was the one that stung. As a former graphics editor who toiled in that vineyard when we had nothing but rocks and stumps, I wondered aloud whether informational graphics had just been a fad. Others weren’t ready to concede that. Marty Petty argued that graphics still engage readers and that the failure was in execution — chasing the big, sexy stuff instead of the basic maps and charts that inform. Mr. Curtis tied it to incentives:

Today, editors don’t value them highly anymore because they aren’t rewarded for them, and if you aren’t rewarded, you don’t do it.

On people — which I said then, and still believe, is the greatest challenge — 80 percent of respondents found hiring qualified visual journalists either very difficult or about as hard as it had always been, and the survey said it was getting worse. Asked where they’d put additional staff money, respondents put reporting first at 53 percent, design at 37 percent, online at 30 percent, graphics at 28 percent, photography at 27 percent and illustration at 13 percent. Roger Fidler noted that at Kent State most of the better students were looking at the Web and electronic publishing, and saw newspapers as passé.

The online results astounded me. Only 10 percent thought it highly important that a newspaper’s Web site look like the printed newspaper; 50 percent said it wasn’t important at all. So much for brand. And on leveraging print journalists online, the responses split roughly in thirds — including a third who thought it wasn’t very important at all.

Then there was space. Sixty percent said they had more room for visual packages than five years earlier, and looking ahead, everybody expected still more — this with the 50-inch web coming at the industry.

Everybody thinks they’re going to have more space in the future…what planet were these people on when they answered this question.

Two quotes from the session have stayed with me. Juan Antonio Giner, relayed by Warren: “newspaper design is dead; news design is alive.” And Mr. Lockwood, closing the argument with the Bauhaus:

Laszlo Maholy-Nagy said years and years ago from the Bauhaus that design isn’t a profession; it is an attitude. It is an attitude about information.

I ended on a deliberately hopeful note, pointing out that in Blade Runner — one of the darker visions of the late 20th century — our hero waits for his dinner while reading a printed newspaper. Reading this back now, well past the 2020 horizon we were asked to imagine, the survey’s optimism about space looks even more misplaced, and the disconnect between editors and designers turned out to be the least of the industry’s problems. But the argument about whether visual work is content or decoration never really got settled. It just moved to a different screen.

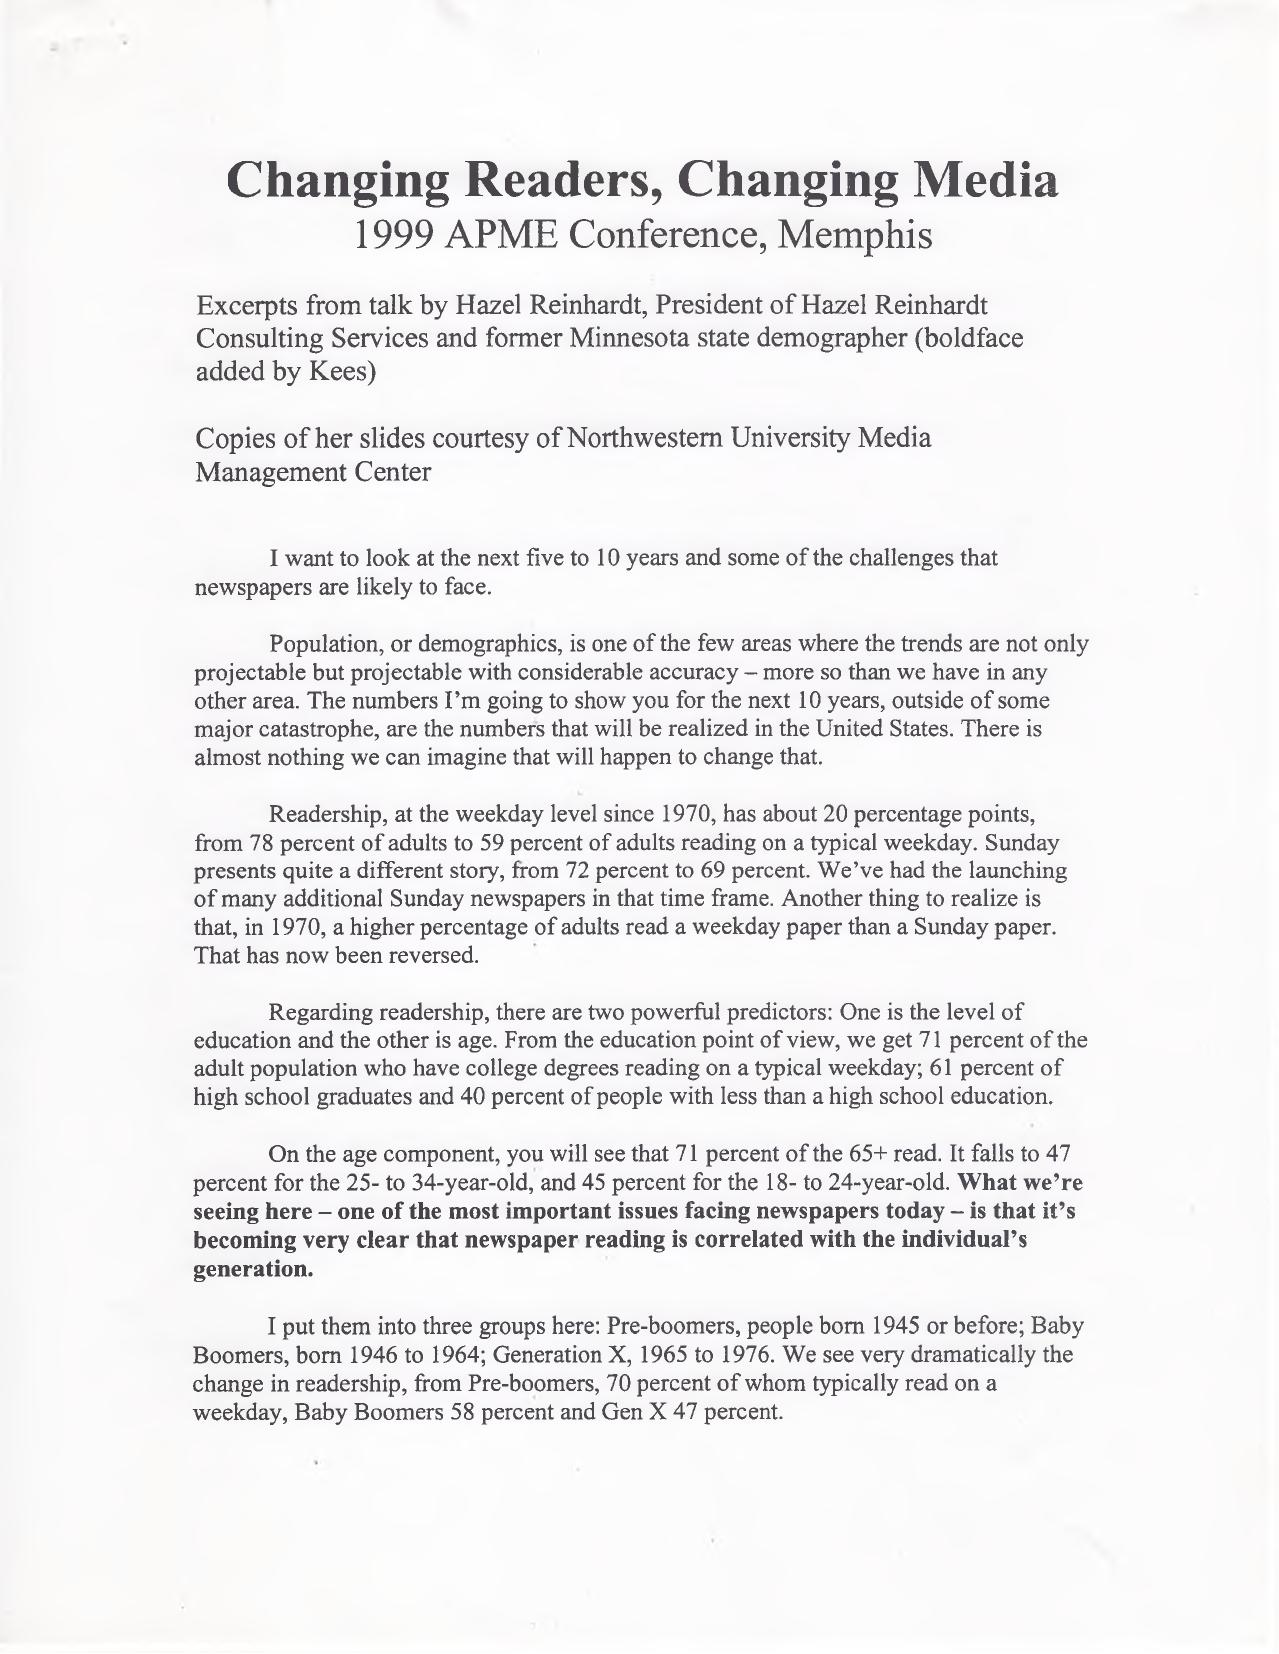
Archival transcript of Hazel Reinhardt's newspaper readership demographics talk at the 1999 APME Conference in Memphis

Changing Readers: A Demographic Warning to APME, 1999

This is a set of excerpts from a talk given by Hazel Reinhardt at the 1999 APME Conference in Memphis. Reinhardt was president of Hazel Reinhardt Consulting Services and the former Minnesota state demographer, and her subject was the one part of the newspaper business that could be forecast with confidence. The document notes that copies of her slides were provided courtesy of the Northwestern University Media Management Center, and that the boldface in the transcript was added by Kees.

Her opening argument was that demographics, unlike almost everything else the industry worried about, were not a matter of speculation.

The numbers I’m going to show you for the next 10 years, outside of some major catastrophe, are the numbers that will be realized in the United States. There is almost nothing we can imagine that will happen to change that.

The readership numbers were the sobering part. Weekday readership had fallen from 78 percent of adults in 1970 to 59 percent; Sunday had barely moved, from 72 percent to 69 percent. Education and age were the two powerful predictors — 71 percent of college graduates read on a typical weekday versus 40 percent of those with less than a high school education, and 71 percent of adults 65 and older versus 45 percent of 18- to 24-year-olds. Broken into generations, the pattern was unmistakable: Pre-boomers at 70 percent, Baby Boomers at 58 percent, Generation X at 47 percent.

It’s a mystery to me that we could have known about this for so long but seemed to not want to talk about it: Each generation of younger people is reading less or less frequently.

From there she walked the audience through four population changes — an aging population, growing racial and ethnic diversity, a widening gap between rich and poor, and the concentration of population in certain regions and metros. She spent the most time on aging: Boomers were then 42 and 43, not 50; fertility was low; the number of Americans over 100 was projected to grow from roughly 37,000 in 1990 to about 137,000 in 2010 and 850,000 by 2050. Households with children would not grow; empty nesters would. Editors who had built their sections around “what’s of interest to families” were going to need another hook.

The hinge of the whole talk was Generation Y, which contributed only 15 million adults in 1998 but would add 65 million by 2010 — 29 percent of all adults. Everything depended on how that generation behaved.

If Generation Y reads at the same level as Generation X, overall daily readership will be below 50 percent by 2010 — 45 percent by 2015. Following that train of logic, the last American reading a newspaper would be observed in 2078.

Reinhardt offered a reason for hope — surveys showed Generation Y as more optimistic, more community-minded, more involved than Generation X — and then framed the challenge as a question the room had a very short window to answer:

The challenge to newspapers is how and what do we need to do to make a larger proportion of them newspaper readers than Generation X?

She also dismissed the industry’s favorite consolation, that people pick up the habit as they age. Asked exactly that in the Q&A, she was blunt:

If you did not read a newspaper when you were 35 and you did not read one when you were 45, why would you suddenly take it up at 55 or 65? You have established patterns.

You have a few safe years. Do not be lulled. You have a few years when you have the Boomers and Pre-boomers who are big readers with you. The future is whether you can get Generation Y.

Reading this in 2026, the arithmetic has long since resolved itself, and not in the direction the hopeful reading allowed for. What stands out now is not the forecast but the framing: Reinhardt was telling a room full of editors that the crucial period was the next five to 10 years, and that working on it that day was “none too soon.” Those were the same years the industry spent arguing about what to put on its websites. The demographic clock she described was running the entire time.

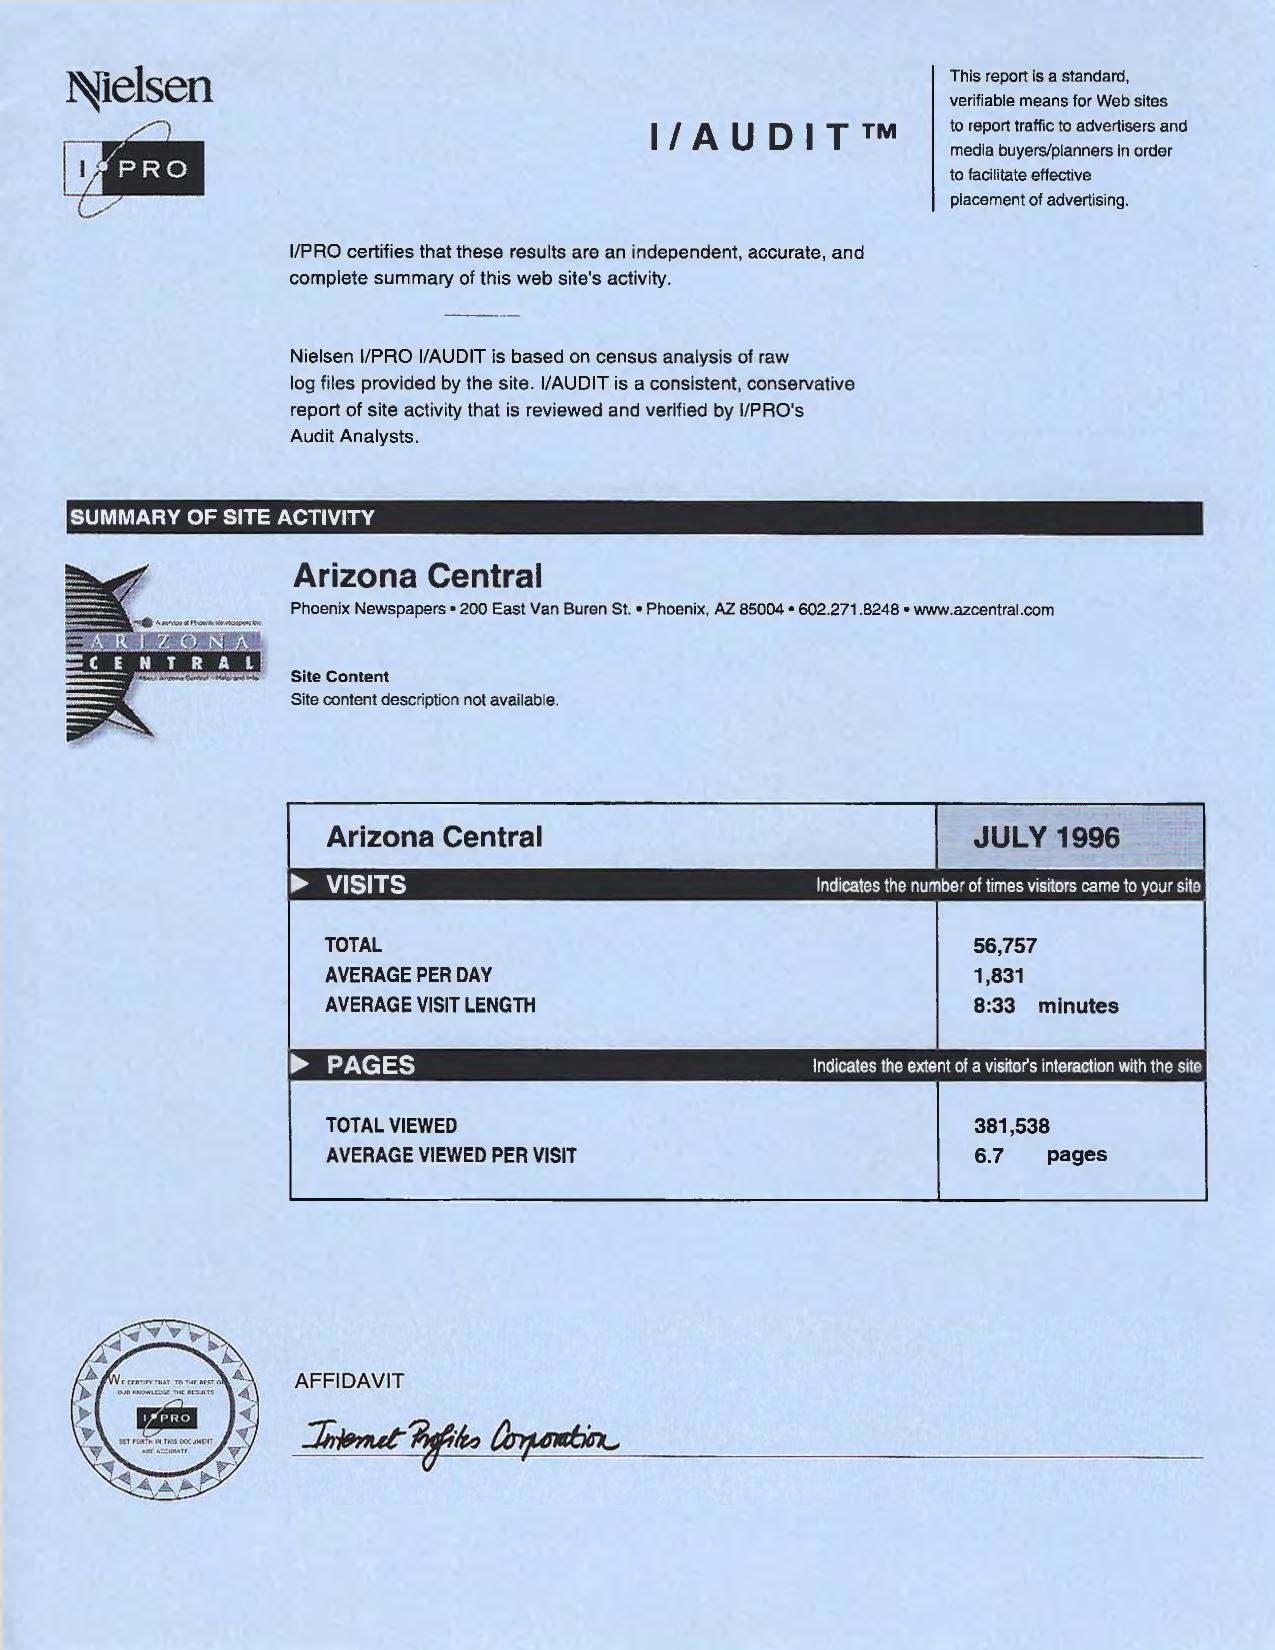
Nielsen I/PRO I/AUDIT report page for Arizona Central, July 1996, listing certified visits, page views, and top pages

Nielsen Audits Arizona Central, July 1996

This is the Nielsen I/PRO I/AUDIT report for Arizona Central for the month of July 1996. I was managing Arizona Central at the time, and this was one of the first attempts by anyone to put an independent, third-party number on what a newspaper web site was actually doing.

The point of the exercise was advertising. If we were going to sell space on the site, someone other than us had to vouch for the traffic:

This report is a standard, verifiable means for Web sites to report traffic to advertisers and media buyers/planners in order to facilitate effective placement of advertising.

I/PRO built the audit from a census analysis of our raw log files, reviewed by their audit analysts, and certified the results as “an independent, accurate, and complete summary of this web site’s activity.” The affidavit language matters more than it might seem now — media buyers had no reason to trust self-reported server numbers.

The month’s totals:

VISITS … TOTAL 56,757 / AVERAGE PER DAY 1,831 / AVERAGE VISIT LENGTH 8:33 minutes

And on the content side, 381,538 pages viewed, an average of 6.7 pages per visit. The top 50 pages accounted for 299,906 pages, or 78.6 percent of everything viewed.

What those top pages were is the interesting part. Job Search, under the classifieds directory, drew 13,584 page views — a reminder of how early classifieds moved online. Alongside the standard departments (FLASH, FEATURES, FUN, comics, Dining, Destinations, the Arizona Golf Guide, the interactive TV listings, Home Buying Choices), the news pages that show up are exactly the stories of that summer in Arizona: “Phoenix bombing plot,” “Symington indicted,” and “Arizona’s Olympians.” There’s also a page titled “Tell us what you think!” — 617 views for the survey.

The visitor-by-organization table is its own time capsule. America Online alone delivered 14,143 visits, more than seven times the next name on the list, Primenet, at 1,824. Arizona State University, GoodNet, CompuServe, Netzone, Microsoft Network, Internet Direct — the local ISPs and the national online services were the on-ramps. The top 50 organizations were 60.7 percent of all site visits. Geographically, 91.0 percent of activity came from the United States, with Canada at 1.8 percent and a scattering from Australia, the Netherlands, Japan, the U.K., and Germany.


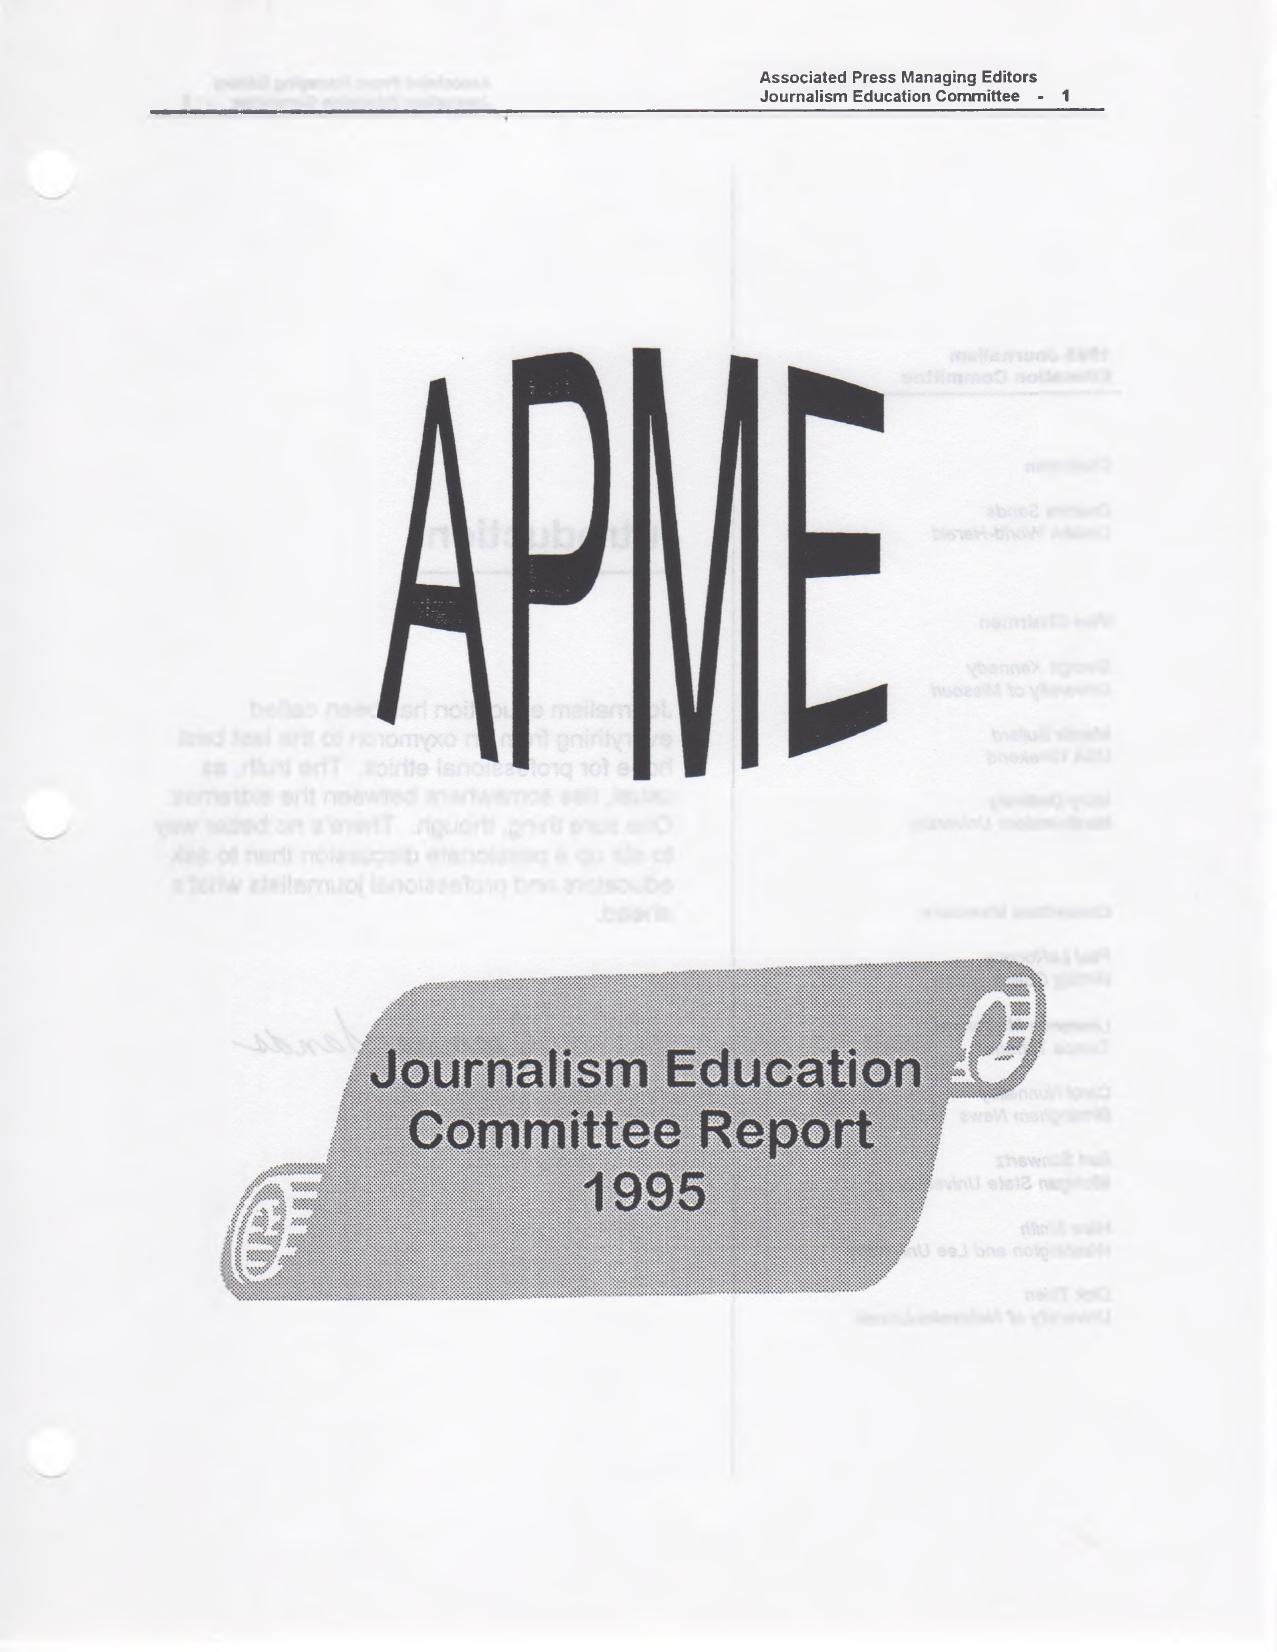
Cover pages of the Associated Press Managing Editors 1995 committee report on journalism education

APME’s 1995 Report on Journalism Education

The 1995 Journalism Education Committee of the Associated Press Managing Editors set itself a straightforward assignment: go back to the committee’s own 1984 study of journalism schools and see how it had held up. Ham Smith of Washington and Lee University, who wrote the lead section, answered in five words — “Mostly, it seems, not much has changed.” The committee was chaired by Deanna Sands of the Omaha World-Herald, with vice chairmen George Kennedy of the University of Missouri, Marcia Bullard of USA Weekend and Mary Dedinsky of Northwestern.

The report opens with a line that still describes the terrain pretty well:

Journalism education has been called everything from an oxymoron to the last best hope for professional ethics. The truth, as usual, lies somewhere between the extremes. One sure thing, though. Thereu2019s no better way to stir up a passionate discussion than to ask educators and professional journalists whatu2019s ahead.

Smith lays out the structural mismatch between newsrooms and J-schools: about 80 percent of entry-level daily newspaper jobs went to journalism majors, while fewer than 20 percent of journalism students were in the news-editorial sequence. Small papers wanted graduates who could work the first day; big papers wanted an education and hired five years later from the small papers. Paul LaRocque reports on a survey the committee mailed to 202 journalism schools, accredited and non-accredited, which drew 128 responses u2014 a 63 percent return u2014 measuring schools against the 1984 recommendations.

The sharpest material is about accreditation. Bob Giles, then editor and publisher of The Detroit News and president of the accrediting council, had told a February gathering of deans at the University of Maryland something the American Journalism Review called an extraordinary statement:

u201cJournalism education still seems to fall uncomfortably between universities and the industry. Neither has embraced journalism education. Too many universities seem more comfortable with the idea of mass communications as a research-based discipline, while the industry wants graduates who can do journalism, but is not willing to make a full commitment of support.u201d

u201cAs the number of accredited programs has increased … it is clear that we can no longer give that assurance.u201d

George Kennedy’s chapter tracks the fight over Giles’ proposal to recognize merit beyond the minimum standards u2014 first framed as a u201ctwo-tier system,u201d a phrase quickly abandoned. Florida A&M Dean Robert Ruggles: u201cYouu2019re either accredited or youu2019re not. Degrees of accreditation make no sense.u201d Jerry Ceppos of the San Jose Mercury News, APME’s representative on the council, was on the other side: u201cAny time you can get journalism education to raise standards, thatu2019s a good thing.u201d Maryland’s Reese Cleghorn had advice for editors who wanted to help u2014 get to know the programs, support the good ones, u201cAnd increase starting salaries.u201d

Berl Schwartz of Michigan State interviews Giles at length. Carol Nunnelley of The Birmingham News profiles the University of Alabama’s Institute for Communication Research, whose biggest customer was Southern Progress Corp. And Dick Thien of Nebraska closes the report with u201cA Dangling Conversation,u201d a bus ride in which an editor and an educator answer for each other’s sins without knowing they are seated side by side. It ends with both of them giving the same answer to the same question:

u201cI love it u2014 and if I do it right I can make a difference.u201d

Two passages date the document usefully. Lawrence McConnell of the Tampa Tribune, whose paper u201cled Media Generalu2019s leap into cyberspace with Tampa Bay Online on Prodigy,u201d says flatly: u201cIf there is such a thing as journalism school graduates prepared for this field today, I have yet to meet them.u201d And John Driscoll, retired from The Boston Globe, notes that ASNE offered a videotape on the future of journalism at cost, $10, hoping it would spark curriculum discussions. u201cAlas, only 70 were sold.u201d

I keep this one because the argument in it never ended. A decade later I was at Poynter building News University, and much of that work was aimed squarely at the gap this committee was describing u2014 professionals who wanted training and educators who wanted respect, with not much traffic between them. Reading it in 2026, with journalism programs still being merged, renamed or closed, and with AI now doing to the newsroom what the Internet was doing in 1995, the committee’s central finding holds up better than anyone should want it to.

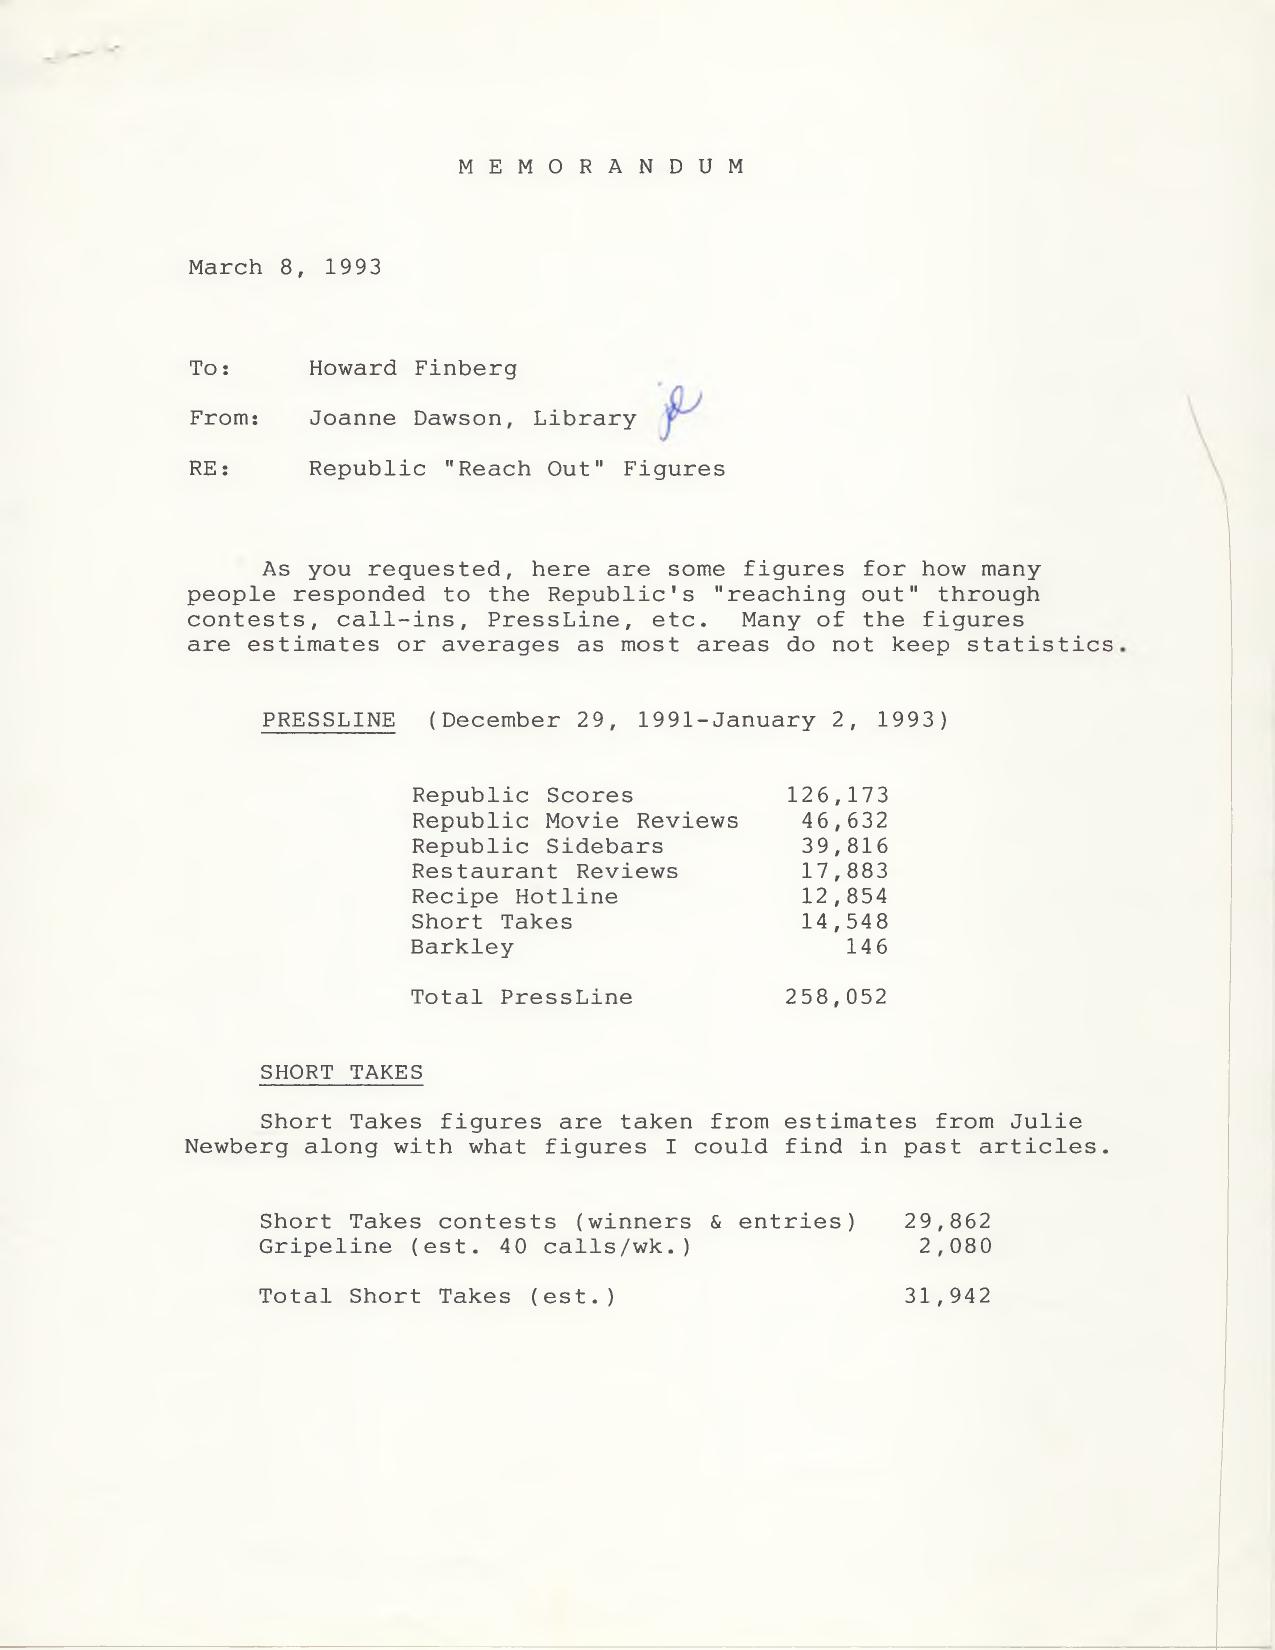
Typed 1993 memo from the Arizona Republic library listing reader response counts for PressLine, contests and call-ins

Reader Connections at the Republic

In early 1993 I asked the Arizona Republic’s library to pull together numbers on how many readers were actually responding to the paper’s various ways of inviting them in — contests, call-ins, the PressLine audiotext service. Joanne Dawson, the librarian, came back with this tally, along with a sensible caveat about the state of the data.

As you requested, here are some figures for how many people responded to the Republic’s “reaching out” through contests, call-ins, PressLine, etc. Many of the figures are estimates or averages as most areas do not keep statistics.

PressLine was the biggest piece, with 258,052 calls between December 29, 1991 and January 2, 1993. Sports scores dominated at 126,173, followed by movie reviews, sidebars, restaurant reviews and the recipe hotline. Short Takes, the Kids Page, sports phone-ins and a handful of contests filled out the rest.

GRAND TOTAL (est.) 334,790

What strikes me looking at this in 2026 is that almost nobody was keeping statistics. A third of a million reader interactions in a year, and most of it had to be reconstructed from old articles and someone’s best estimate of “40 calls/wk.” The audience was there and talking back — the newspaper just had no habit of measuring it. Web analytics would arrive soon enough and change that permanently.

Cover of the Newspaper Advertising Bureau's October 1987 report summarizing the 1987 Newspaper Inventory Survey of U.S. daily newspapers

Daily Newspapers ’87: Taking Stock

An October 1987 report from the Newspaper Advertising Bureau summarizes the findings of NAB’s 1987 Newspaper Inventory Survey — a mail survey of every daily and Sunday/weekend newspaper in the United States and Canada, and the fifth in a series that began in 1967 and continued in 1974, 1979 and 1983. This volume covers local, English-language weekday editions in the U.S. only; a companion volume handled Sunday and weekend editions.

The survey’s original purpose was commercial: give advertisers and agencies a way to find newspapers carrying particular standing features, so an ad could be positioned next to the right kind of content. Later editions added questions about content, graphics and layout, positioning practices, ROP color, zoning, split runs and home delivery. The 1987 weekday inventory counted twelve kinds of sections and fifty-eight kinds of features or columns. (Pretty quaint given how ads are placed today.)

The base for the tables:

The summary tables shown are based on completed questionnaires from 987 daily newspapers representing 59% of all United States dailies and 79% of total circulation.

On content, the report found the churn of the early 1980s hadn’t slowed:

Findings from the 1987 Newspaper Inventory show that the period of rapid change in content, previously noted in the 1979 and 1983 inventories, continues unabated. Since 1983, nearly seven out of ten newspapers (69%) report substantial changes in content.

The most frequently reported changes were increased business coverage (53% of newspapers), increased sports coverage (45%), and a shift in the ratio of state and local to national and international coverage (35%).

The design numbers are the ones I keep coming back to. Eighty-two percent of newspapers — 91% of circulation — reported substantial changes in graphics or layout since 1983. More use of ROP color (61%) and conversion to Standard Advertising Units (SAU) page and column specs (60%) led the list, followed by changed mastheads, changed typefaces, more photographs, and modular front pages. And then this:

There has also been a substantial increase in use of computer graphics. In the 1987 study, 28% of responding dailies (52% of circulation) reported more use of graphics compared to 2% in 1983 (3% of circulation).

The feature tables are a time capsule. Crossword puzzles appeared in 98% of weekday circulation, spectator sports 94%, astrology 92%, TV log 92%, business and finance 89%, weather map 89%. Ninety-five percent of responding papers carried comic strips, and the typical weekday edition had three physically separate sections. Zoning was reported by 30% of dailies but 59% of circulation. The median share of weekday circulation that was home delivered: 85%.

The study was directed by Charles Lehman of NAB’s Research Department, and the report was updated by Dorothy Shea. A computerized list of editions carrying any particular section or feature was available on request — by telephone.

Reading this in 2026, what stands out isn’t just how many of these features have vanished from print (the TV log, the movie timetable, the radio log, the stock tables) but that the inventory itself was a product for advertisers — a printed, mailed, hand-tabulated database of what newspapers contained. That function moved online long ago, along with the advertising it was built to serve. The Newspaper Advertising Bureau no longer exists as a separate organization; its work eventually merged into the industry association that became the Newspaper Association of America.