Driving Web to Print

At the 2002 IFRA Asia Conference in Bangkok (held March 20–22, 2002), I presented findings from a research project close to my heart—one that explored how newspapers could actually increase print subscriptions using their websites. Yes, increase. At the time, this idea ran counter to the conventional wisdom that digital only eroded print. [This is is a summary from my presentation slides.]

The project was a collaboration between my consultancy, Finberg-Gentry, and a number of forward-thinking circulation and online leaders across the industry. Our research included:

  • Over 100 site reviews
  • 290 responses from circulation managers
  • And dozens of in-depth interviews with media professionals

We asked a simple but often overlooked question: What if the web could help sell the newspaper?

What we found was encouraging—and revealing.

Some newspapers were already leveraging their digital platforms to drive subscriptions, but these successes had something in common: cooperation. When online and circulation teams worked together, when they shared goals and data, the results followed.

Unfortunately, that kind of collaboration was rare. Too often, subscription links were hidden “below the fold.” Technology systems didn’t talk to each other. Customer data wasn’t shared. And the user experience—especially for signing up or managing delivery—was clunky at best.

We identified several key challenges:

  • Most newspapers didn’t have an integrated system for online and print circulation.

  • Subscription buttons were buried or mislabeled—making it hard for users to take action.

  • Only 15% of papers offered web-exclusive pricing.

  • Many didn’t even allow basic customer service functions—like stopping or holding delivery—online.

But there were bright spots.

The Minneapolis Star Tribune used contests to generate over 6,000 subscription orders a year. The Poughkeepsie Journal tracked retention of web-generated subscriptions and found they performed just as well—if not better—than other channels. The Houston Chronicle developed a user-friendly online service center that set a new standard for self-service.

What all these examples showed was that technology and strategy must go hand-in-hand. We couldn’t just slap a “Subscribe” link on a site and hope it worked. We needed to design digital experiences that respected what users had come to expect—speed, convenience, clarity—and we needed to do it without forgetting the power and value of the printed product.

In the end, my presentation message was simple: web and print aren’t rivals—they’re partners. But partnership requires intent. It requires shared ownership. And, perhaps most importantly, it requires that we stop thinking in silos.

The opportunity for newspapers to increase their audiences across platforms is still very real. But it’s up to us to build the systems, culture, and customer experiences to make it happen. The full report is available on this site.
Newspaper Circulation Report, 1988

It is striking how far circulation numbers have fallen.  I found a page from Editor & Publisher from 1988 that reported on the top 25 newspapers in the U.S. in terms of circulation. The decline is striking. Here’s the start of the story:

By Mark Fitzgerald
When the year began, numerous newspaper advertising analysts declared that 1988 would be a banner year.

Midway through this lackluster year, they revised their projections downward.

Much the same thing seems to be happening with newspaper circula­tion, according to the results of the latest FAS-FAX report from the Audit Bureau of Circulations.

When the FAS-FAX for the six months ended March 31, 1988, came out, daily circulation seemed a special bright spot in a dull year.
With the release of the FAS-FAX for six months ended Sept. 30, 1988, however, the other shoe has dropped.

Here’s a look at five newspapers, 1988 versus 2023-24 daily circulation data:

Newspaper                1988                Most Recent               Decline (%)
Wall Street Journal 1,869,000       609,654     2023      ~67%
New York Times       1,116,334         296,329     2023      ~73%
Los Angeles Times   1,112,344         118,760       2023     ~89%
Chicago Tribune       1,098,127          73,000       2024    ~93%
Arizona Republic      320,409            67,510        2023     ~79%

The complete list of 25 is available in the article. It includes Sunday circulation numbers.


The complete list of 25 is available in the article. It includes Sunday circulation numbers.


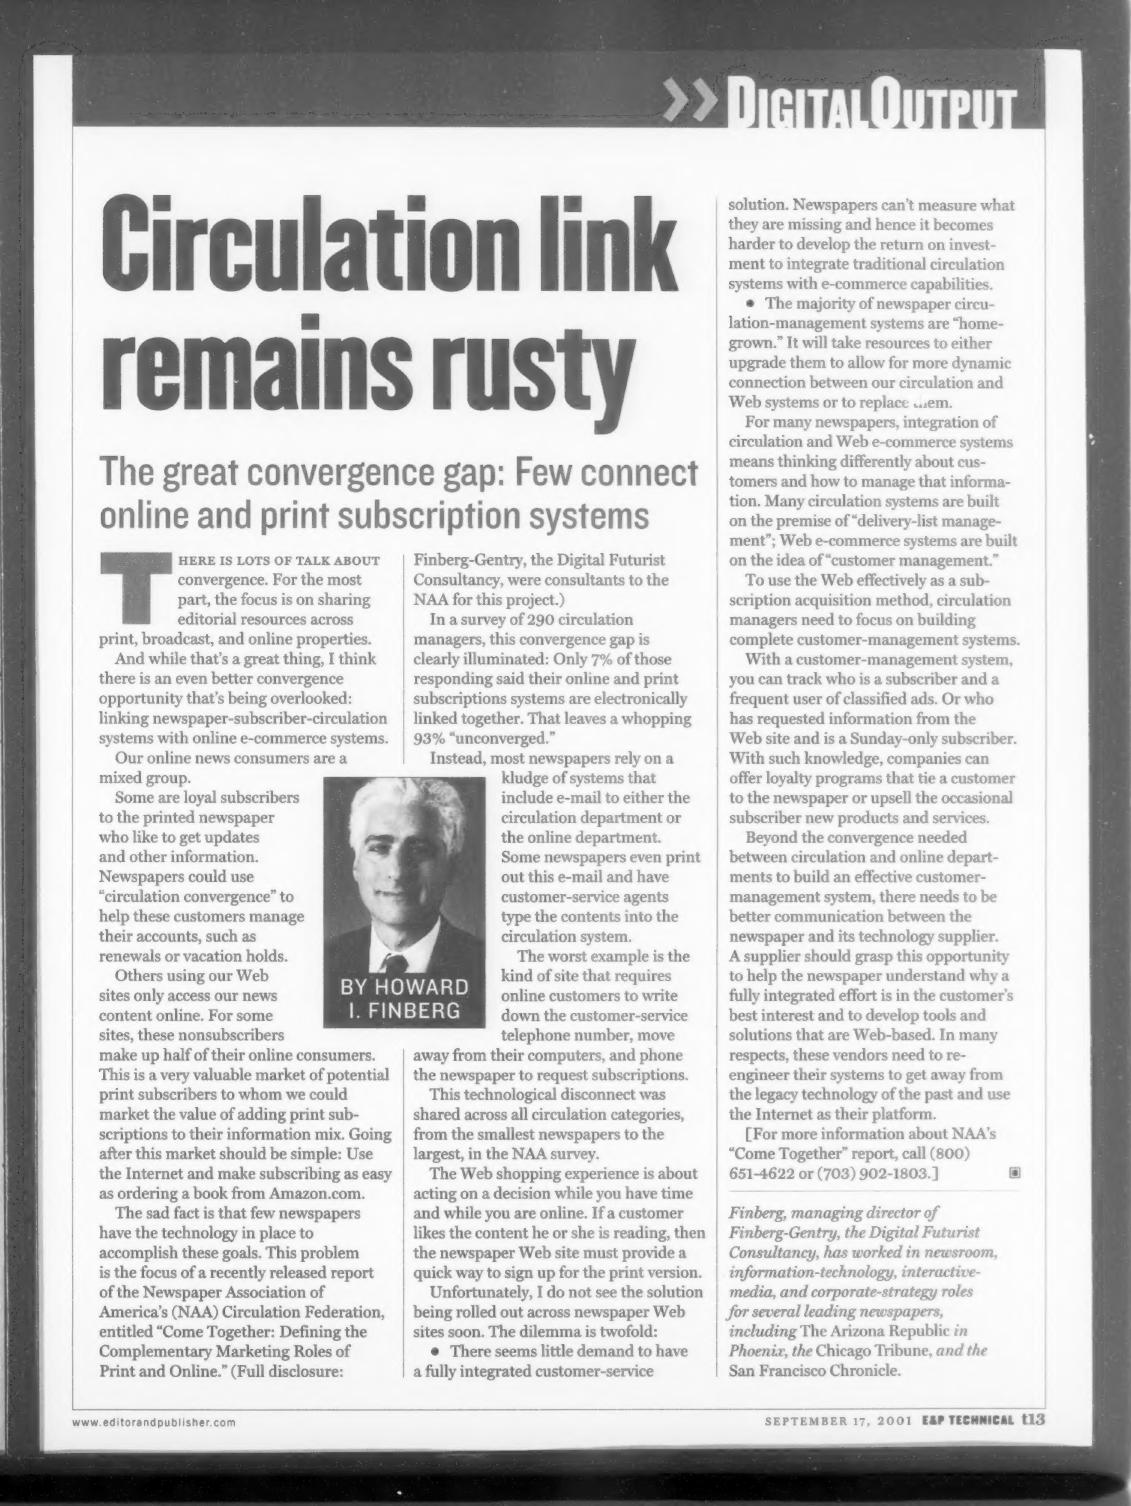
Tearsheet of the September 17, 2001 E&P Technical column headlined "Circulation link remains rusty" about the convergence gap between print and online subscription systems

Circulation-Web Link Remains Rusty, 2001

A column I wrote for E&P Technical, published September 17, 2001, under the headline “Circulation link remains rusty” and the deck “The great convergence gap: Few connect online and print subscription systems.” The argument: while the industry’s convergence conversation was focused on sharing editorial resources across print, broadcast, and online, a bigger opportunity was being ignored — connecting newspaper subscriber-circulation systems to online e-commerce systems.

And while that’s a great thing, I think there is an even better convergence opportunity that’s being overlooked: linking newspaper-subscriber-circulation systems with online e-commerce systems.

The column drew on a then-newly released report from the Newspaper Association of America‘s Circulation Federation, “Come Together: Defining the Complementary Marketing Roles of Print and Online.” As the column disclosed, Finberg-Gentry, the Digital Futurist Consultancy, were consultants to the NAA on the project. A survey of 290 circulation managers supplied the central number:

Only 7% of those responding said their online and print subscriptions systems are electronically linked together. That leaves a whopping 93% “unconverged.”

What newspapers used instead was described as “a kludge of systems” — e-mail to the circulation or online department, sometimes printed out and retyped into the circulation system by customer-service agents. The column singled out one practice as the worst case:

The worst example is the kind of site that requires online customers to write down the customer-service telephone number, move away from their computers, and phone the newspaper to request subscriptions

The disconnect held across all circulation size categories, from the smallest papers to the largest. The column identified a twofold dilemma: little internal demand for a fully integrated customer-service solution (papers “can’t measure what they are missing,” making ROI hard to build), and the fact that most circulation-management systems were “home-grown” and would take resources to upgrade or replace.

The underlying problem was framed as a difference in premise between the two kinds of systems:

Many circulation systems are built on the premise of “delivery-list management”; Web e-commerce systems are built on the idea of “customer management

The recommendation was for circulation managers to build complete customer-management systems — tracking, for example, who is a subscriber and a frequent user of classified ads, or who has requested information from the Web site and is a Sunday-only subscriber — to support loyalty programs and upselling. The column also called for better communication between newspapers and their technology suppliers, arguing vendors needed to re-engineer away from legacy technology and toward the Internet as their platform.

Cover of the Newspaper Advertising Bureau's October 1987 report summarizing the 1987 Newspaper Inventory Survey of U.S. daily newspapers

Daily Newspapers ’87: Taking Stock

An October 1987 report from the Newspaper Advertising Bureau summarizes the findings of NAB’s 1987 Newspaper Inventory Survey — a mail survey of every daily and Sunday/weekend newspaper in the United States and Canada, and the fifth in a series that began in 1967 and continued in 1974, 1979 and 1983. This volume covers local, English-language weekday editions in the U.S. only; a companion volume handled Sunday and weekend editions.

The survey’s original purpose was commercial: give advertisers and agencies a way to find newspapers carrying particular standing features, so an ad could be positioned next to the right kind of content. Later editions added questions about content, graphics and layout, positioning practices, ROP color, zoning, split runs and home delivery. The 1987 weekday inventory counted twelve kinds of sections and fifty-eight kinds of features or columns. (Pretty quaint given how ads are placed today.)

The base for the tables:

The summary tables shown are based on completed questionnaires from 987 daily newspapers representing 59% of all United States dailies and 79% of total circulation.

On content, the report found the churn of the early 1980s hadn’t slowed:

Findings from the 1987 Newspaper Inventory show that the period of rapid change in content, previously noted in the 1979 and 1983 inventories, continues unabated. Since 1983, nearly seven out of ten newspapers (69%) report substantial changes in content.

The most frequently reported changes were increased business coverage (53% of newspapers), increased sports coverage (45%), and a shift in the ratio of state and local to national and international coverage (35%).

The design numbers are the ones I keep coming back to. Eighty-two percent of newspapers — 91% of circulation — reported substantial changes in graphics or layout since 1983. More use of ROP color (61%) and conversion to Standard Advertising Units (SAU) page and column specs (60%) led the list, followed by changed mastheads, changed typefaces, more photographs, and modular front pages. And then this:

There has also been a substantial increase in use of computer graphics. In the 1987 study, 28% of responding dailies (52% of circulation) reported more use of graphics compared to 2% in 1983 (3% of circulation).

The feature tables are a time capsule. Crossword puzzles appeared in 98% of weekday circulation, spectator sports 94%, astrology 92%, TV log 92%, business and finance 89%, weather map 89%. Ninety-five percent of responding papers carried comic strips, and the typical weekday edition had three physically separate sections. Zoning was reported by 30% of dailies but 59% of circulation. The median share of weekday circulation that was home delivered: 85%.

The study was directed by Charles Lehman of NAB’s Research Department, and the report was updated by Dorothy Shea. A computerized list of editions carrying any particular section or feature was available on request — by telephone.

Reading this in 2026, what stands out isn’t just how many of these features have vanished from print (the TV log, the movie timetable, the radio log, the stock tables) but that the inventory itself was a product for advertisers — a printed, mailed, hand-tabulated database of what newspapers contained. That function moved online long ago, along with the advertising it was built to serve. The Newspaper Advertising Bureau no longer exists as a separate organization; its work eventually merged into the industry association that became the Newspaper Association of America.