PAFET Operating Committee, April 1996

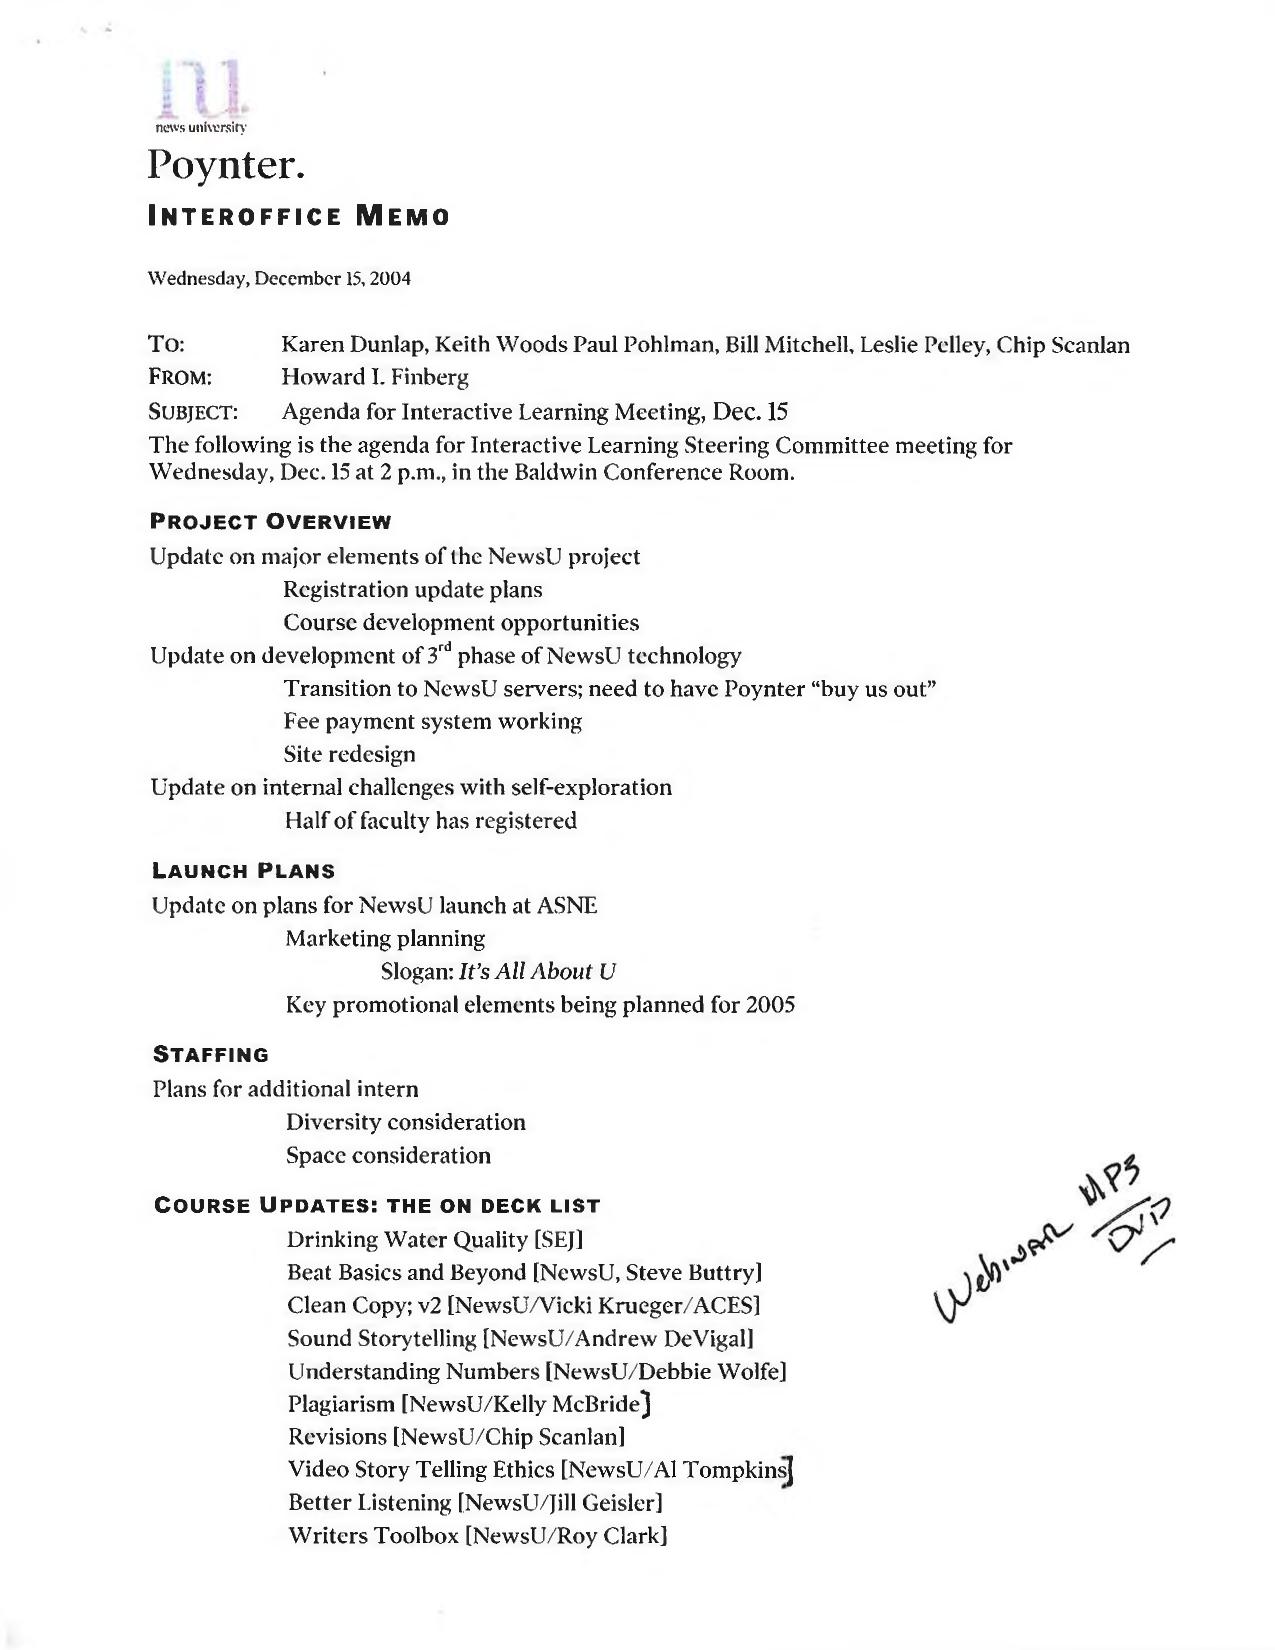
PAFET Operating Committee meeting and agenda. Held in Phoenix, AZ. Includes documents about “Elect to Connect,” a project involving Newspapers in Education.

The NIE Project was initially established as an experiment in conducting joint development within PAFET. This area was selected in part based on the existing relationships (and history of collaboration) among PAFET NIE representatives. After several discussions, the group decided to focus the project on jointly developing curriculum to support the 1996 Elections. The curriculum would contain both a print and “new media” component (e.g. online/Internet, diskette, and/or CD-ROM).

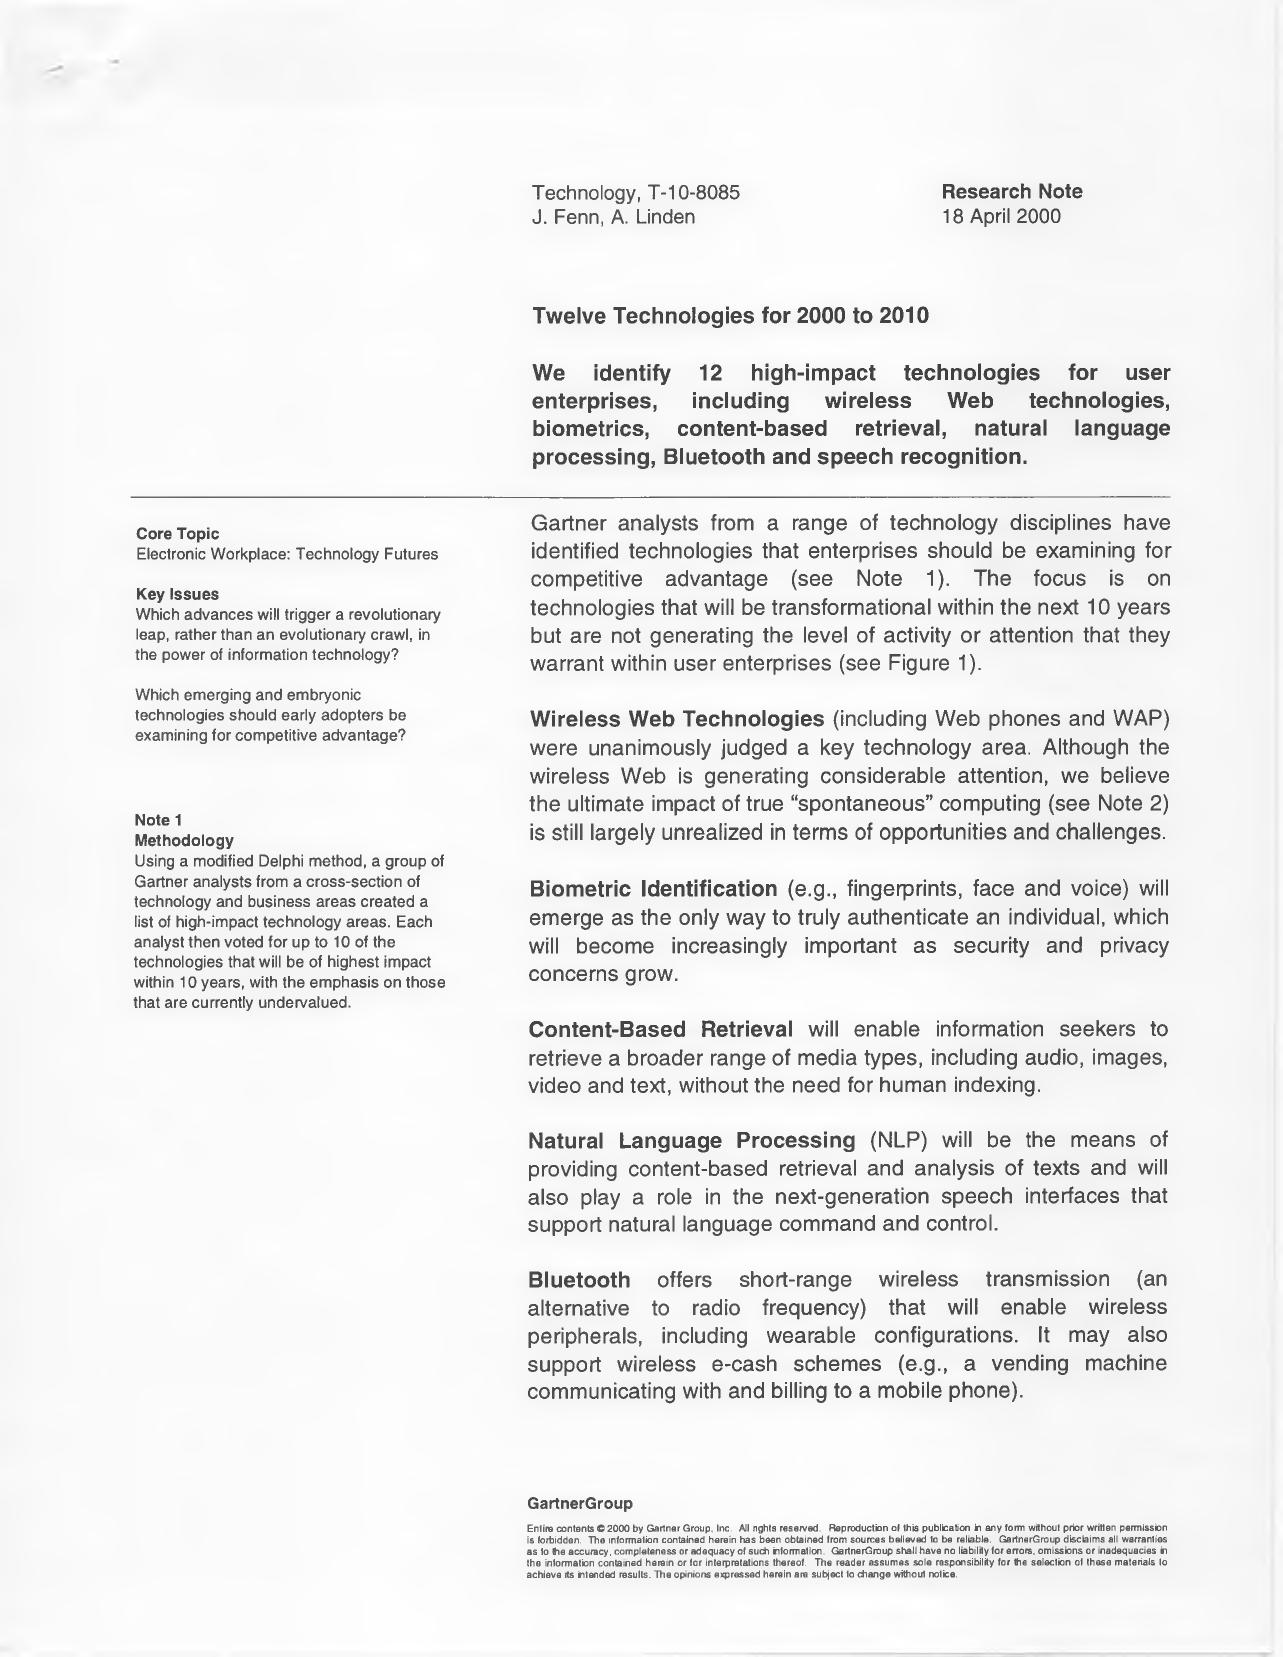
Gartner research note listing twelve high-impact technologies with a Technology Radar Screen adoption timeline

Gartner’s Twelve Technologies For 2000 To 2010

A Gartner research note (Technology, T-10-8085) by analysts J. Fenn and A. Linden, forecasting the technologies that would reshape enterprise computing over the coming decade. The note is short — two pages — but it is a useful snapshot of what the industry’s most-quoted research firm thought mattered as the century turned.

We identify 12 high-impact technologies for user enterprises, including wireless Web technologies, biometrics, content-based retrieval, natural language processing, Bluetooth and speech recognition.

The twelve, as listed: Wireless Web technologies (including Web phones and WAP), biometric identification, content-based retrieval, natural language processing, Bluetooth, speech recognition, Webtops, XML for content and data exchange, embedded miniature computers, pattern recognition, e-cash and display technologies.

The methodology was a modified Delphi process — a cross-section of Gartner analysts built a list of high-impact technology areas, then each voted for up to 10, with the emphasis on those judged currently undervalued. Wireless Web technologies were the only unanimous pick.

A “Technology Radar Screen” figure assigns each technology a year marking “the point at which the technology begins the steepest part of its adoption curve”: XML in 2001, wireless Web, Webtops, Bluetooth and NLP in 2002, pattern recognition and content-based retrieval in 2004, speech recognition and biometrics in 2005, e-cash in 2006, display technologies in 2007, and embedded miniature computers in 2008.

The most interesting passage is a sidebar defining what the analysts called spontaneous computing:

An era of spontaneous computing will begin around 2007, predicated on the availability of ubiquitous, reliable wireless connectivity that will provide any time, any place access to information and messaging through highly portable or wearable systems with speech interfaces.

And the consequence they drew from it:

Instead of being the center of attention, information processing will become a secondary activity achieved while the user is performing some other task (driving or sitting in a meeting), leading to true multitasking.

The note closes with the standard Gartner formulation:

Bottom Line: Technology and business planners should evaluate these technologies as part of their technology portfolios to determine the impact on future IT and business directions.

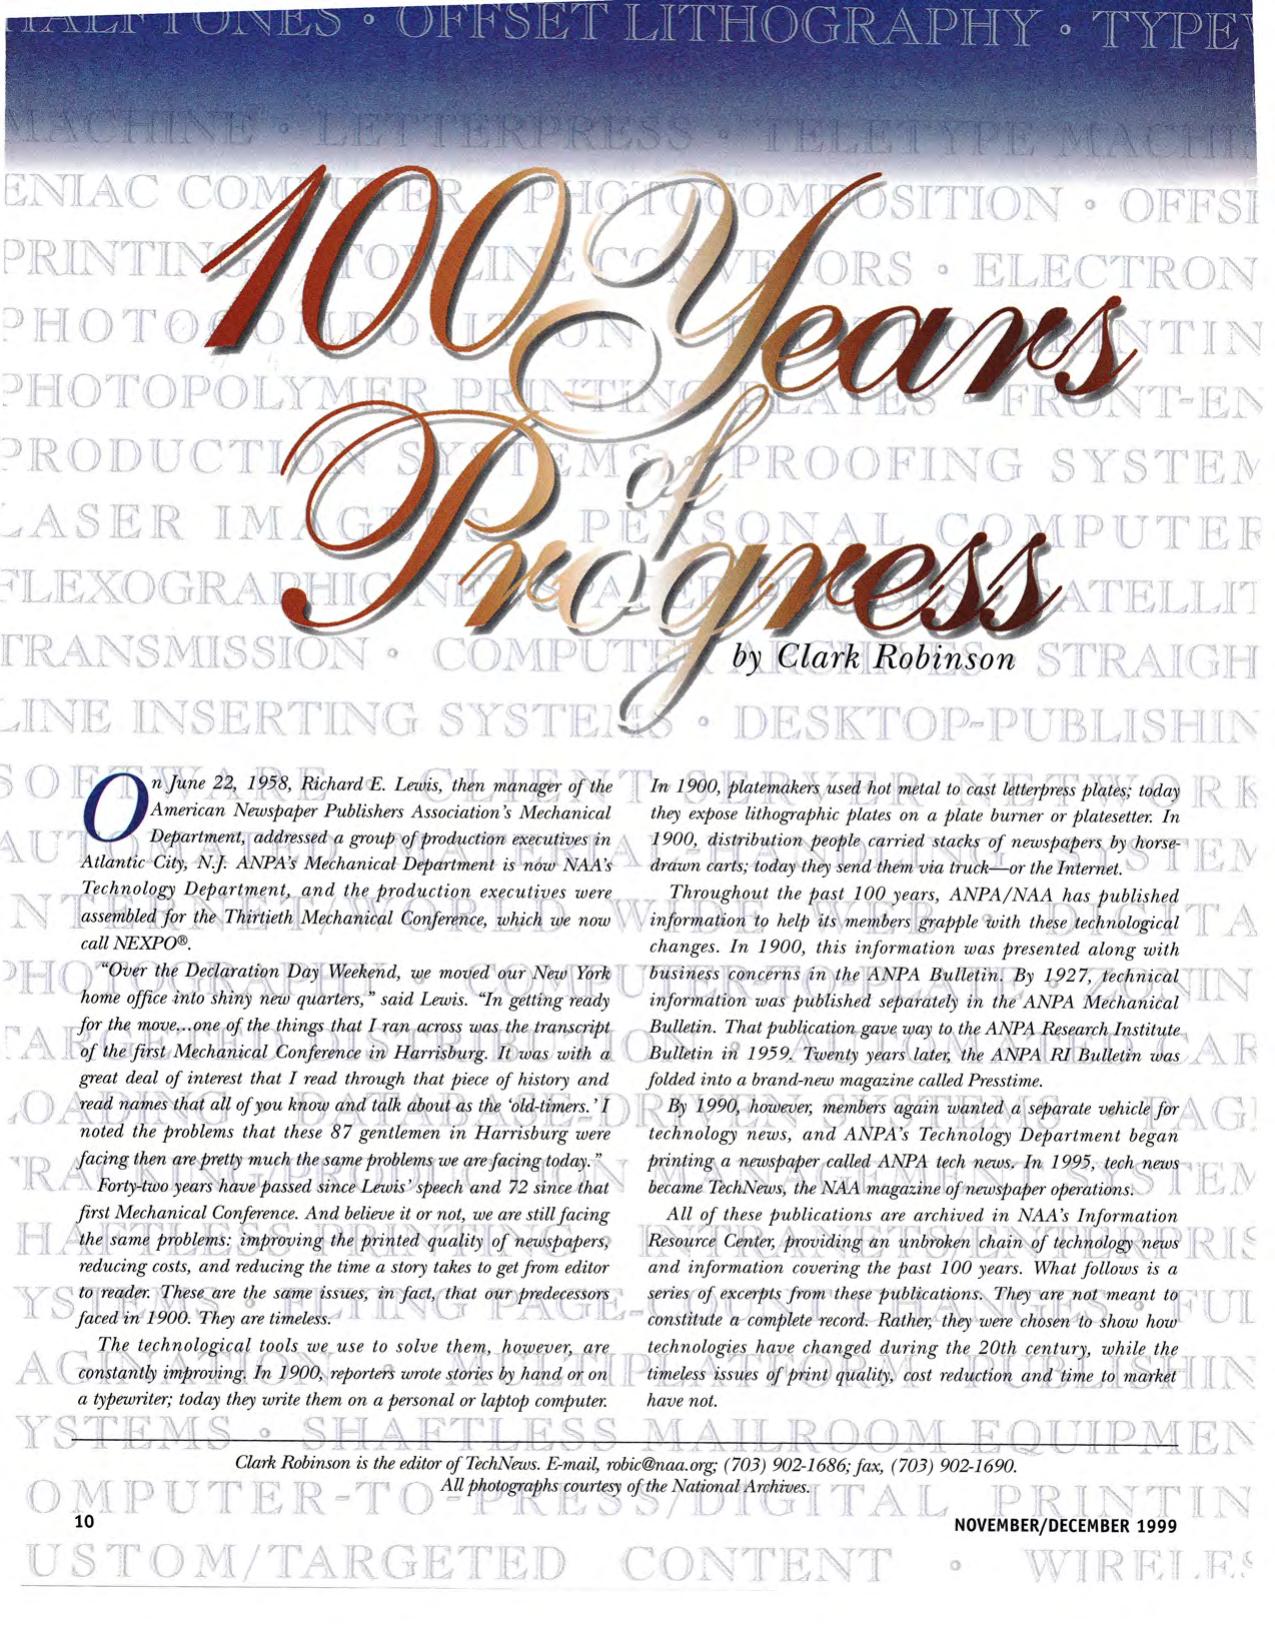
Clipping from the November/December 1999 issue of TechNews, the NAA magazine of newspaper operations, featuring a 100-year retrospective of newspaper technology coverage

100 Years Of Technology News

A clipping from the Newspaper Association of America’s magazine — these pages are from TechNews, “the NAA magazine of newspaper operations,” November/December 1999. The feature is a century-end retrospective assembled by editor Clark Robinson from the association’s own publications: the ANPA Bulletin (1900), the ANPA Mechanical Bulletin (1927), the ANPA Research Institute Bulletin (1959), Presstime (1979), ANPA tech news (1990) and TechNews (1995). All of it archived, the article notes, in NAA’s Information Resource Center — “an unbroken chain of technology news and information covering the past 100 years.”

The organizing idea is that the tools change and the problems don’t. Robinson opens with Richard E. Lewis, then manager of ANPA’s Mechanical Department, speaking to production executives in Atlantic City on June 22, 1958, after reading the transcript of the first Mechanical Conference in Harrisburg, Pa.:

“I noted the problems that these 87 gentlemen in Harrisburg were facing then are pretty much the same problems we are facing today.”

And then makes the same point about his own moment:

Forty-two years have passed since Lewis’ speech and 72 since that first Mechanical Conference. And believe it or not, we are still facing the same problems: improving the printed quality of newspapers; reducing costs, and reducing the time a story takes to get from editor to reader. These are the same issues, in fact, that our predecessors faced in 1900. They are timeless.

The excerpts run from typewriter discounts and newsprint waste percentages in 1900, through Linotype maintenance complaints in 1910, offset presses in 1940, the Fotosetter and the Sheridan stuffer in 1950, to the ANPA Research Institute Bulletin’s 1970 “newsroom of the future” — reporters at CRT consoles, editors with light pens, “a group of editing consoles will take the place of the copy desk.” A 1979 bulletin from Harris Corp.’s Dr. Joseph E. Rowe describes, quite accurately, digital cameras and Photoshop. My favorite is Arthur Ochs Sulzberger, in a 1979 ANPA Research Institute Bulletin, on the terminal in his office:

“At first, I inadvertently caused a problem by signing my notes with my nickname ‘Punch.’ Apparently, that word triggered the system downstairs to spew out paper tape—no one could figure out who wanted all that tape!”

The issue closes with a TechNews fax poll of production executives on their top three priorities for the first 100 days of the new millennium. Nearly every answer begins with Y2K. The best of them, from Kelly Perine, production systems manager at The Columbus (Ohio) Dispatch:

1. Y2K
2. Pagination
3. Vacation.

A note on the publisher: NAA itself was a merger — the association was formed in 1992 when ANPA combined with the Newspaper Advertising Bureau and several other newspaper groups, which is why the article can move so easily between “ANPA/NAA.” In 2016 NAA renamed itself the News Media Alliance. The magazines didn’t survive. Neither Presstime nor TechNews is published today.

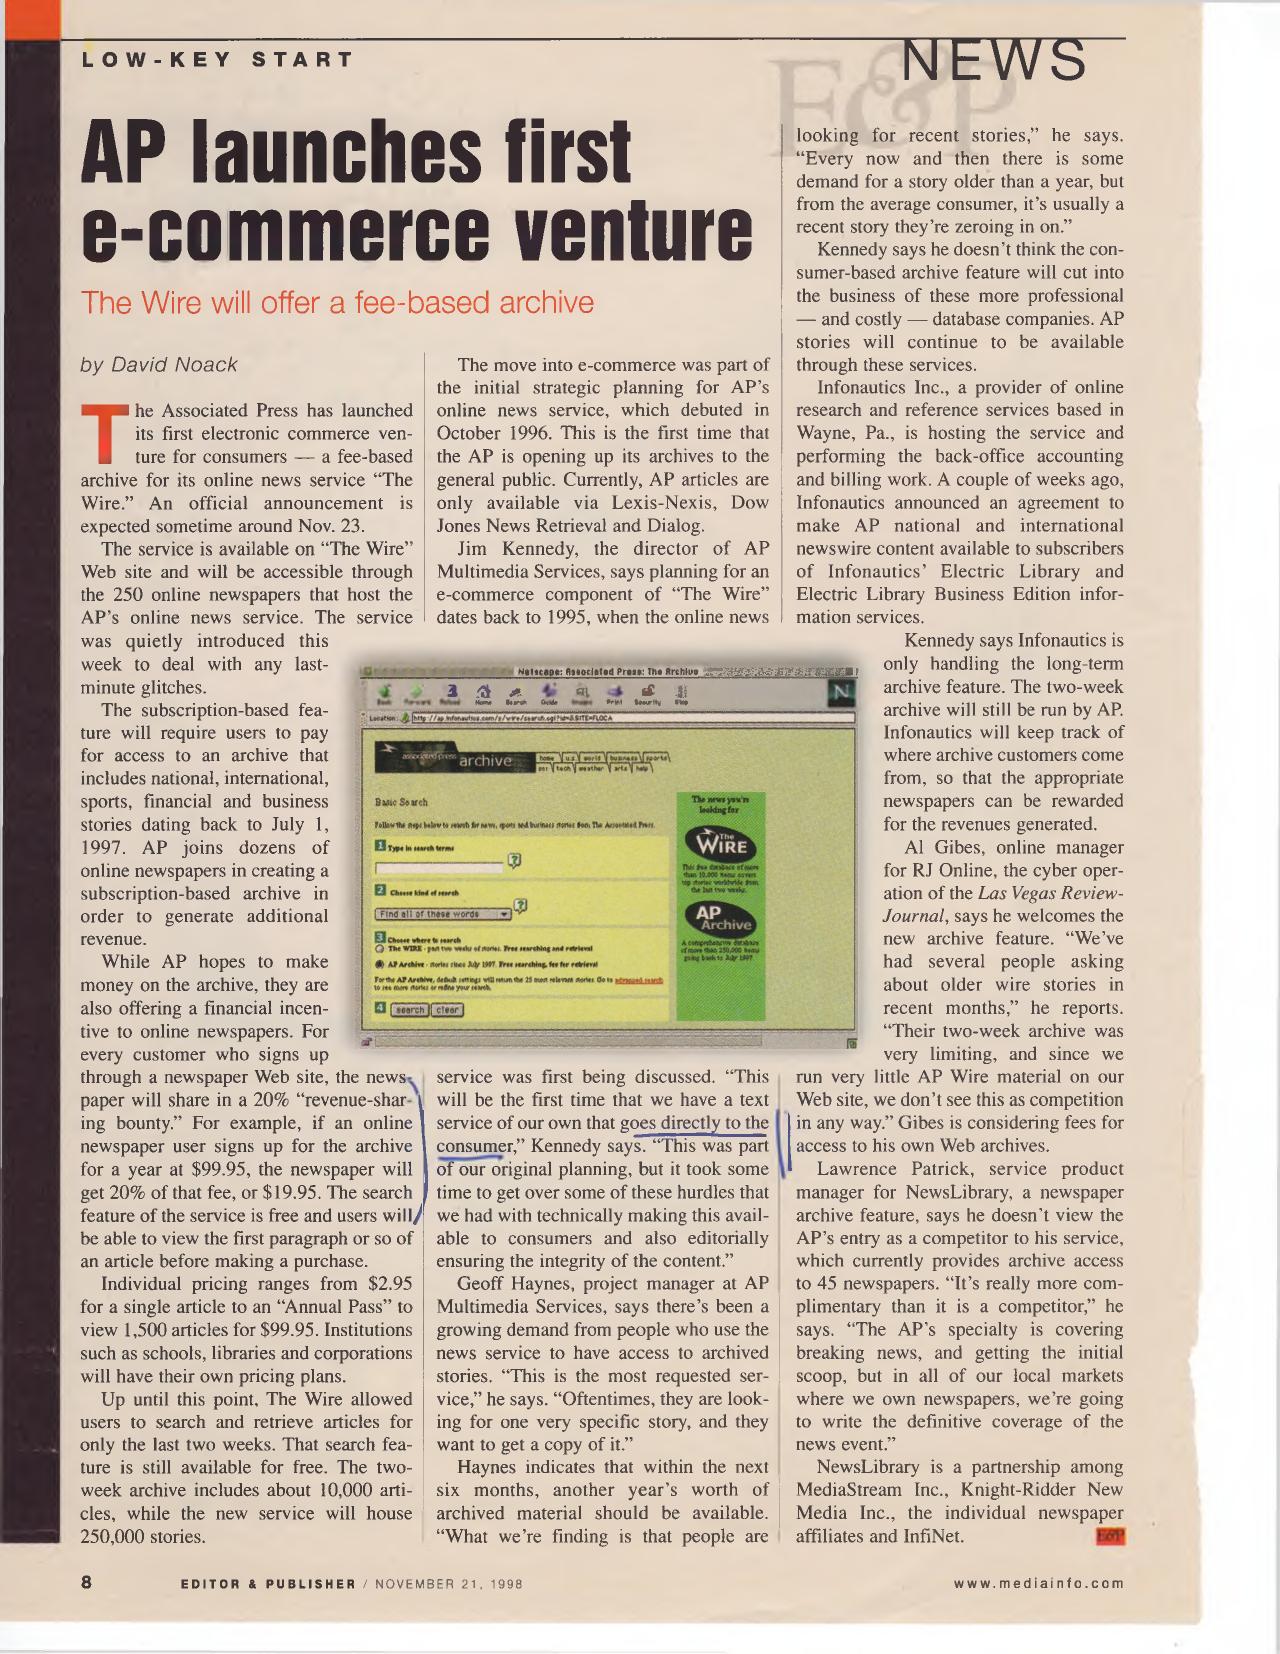
Clipping of David Noack's November 1998 Editor & Publisher article on the AP's fee-based news archive for The Wire

AP Launches Its First Consumer E-Commerce Venture

This November 21, 1998 article from Editor & Publisher, written by David Noack, reports on the Associated Press launching its first electronic commerce venture aimed at consumers: a fee-based archive for its online news service, “The Wire.” The service was available through The Wire’s Web site and the 250 online newspapers that hosted the AP’s online news service, with an official announcement expected around Nov. 23.

The subscription archive covered national, international, sports, financial and business stories dating back to July 1, 1997 — a big jump from the free two-week search, which held about 10,000 articles versus the new service’s 250,000. Individual pricing ran from $2.95 for a single article to a $99.95 “Annual Pass” for 1,500 articles, with a 20% revenue-sharing arrangement for newspapers that signed up customers.

Jim Kennedy, director of AP Multimedia Services, said the e-commerce component had been in the plans since 1995:

“This will be the first time that we have a text service of our own that goes directly to the consumer.”

“This was part of our original planning, but it took some time to get over some of these hurdles that we had with technically making this available to consumers and also editorially ensuring the integrity of the content.”

Pages of an early-1990s seminar handout on the status of informational graphics in U.S. newspapers, drawn from the textbook Visual Editing

Status of Informational Graphics in the U.S.: A Swiss Seminar Handout

In the early 1990s I presented a seminar in Switzerland. Sadly, I don’t remember exactly when or where — which is why this file is going into the Archive section until more information turns up. The handout given to seminar participants also served as my speech. It draws on my then-newly published textbook, Visual Editing: A Graphic Guide for Journalists (1990). The document credits Thomas Hermann with the invitation.

The talk traces the evolution of informational graphics — diagrams, maps, charts and tabular lists — from a murder-scene diagram on Page One of The Times of London on April 7, 1806, through William Playfair’s 1786 The Commercial and Political Atlas, to war maps of World Wars I and II, the space program, and the arrival of USA Today on Sept. 15, 1982. Along the way it notes that the Chicago Tribune created a graphics editor position in 1974, one of the country’s first full-time visual journalists.

One of my favorite quotations, from the Austrian statistician Otto Neurath in 1925, appears early in the text:

“Words divide, pictures unite…to remember simplified pictures is better than to forget accurate figures.”

The handout also reports survey findings from more than 350 members of the American Society of Newspaper Editors, done in connection with the American Press Institute’s 1988 J. Montgomery Curtis seminar: 92 percent expected to use more informational graphics within five years, and 90 percent said graphics would play a greater role in their newspapers in the year 2000.

And a warning that still holds up:

When we run misleading graphics because of a lack of data points or “empty graphics” that are merely type-breakers, we communicate very little and take up precious news space.

The remainder of the handout is drawn from the textbook: chapters on how a graphics editor works — gathering and editing information, request forms, working with artists, fact checking — and a section on choosing the right device, with examples from The Arizona Republic illustrating tables and lists, line/fever charts, pie charts, pictograms, map graphics, and vertical and horizontal bar charts.